@weefuzzy tried it, it is on my radar to do so too, but let us know if you tried it, and what you might like/dislike about it!
Well, their webpage sucks…
There’s like a total of 5 sentences on there total, and the videos don’t work at all on Safari, and on Chromium they play but there’s no audio. So that’s pretty terrible.
I installed and played around a bit. I like that it’s OF and works “as is” without having to faff about much.
Being able to change the parameters (EPS at least) and see the chart updated in real-time (ish) is very useful. Will make tweaking and tuning parameters more useful.
The zooming is handy, though as far as I can tell no new information is showed while zooming. The dots just get “bigger”. Having it dynamically redraw and show more info would probably be more useful (and interesting). (although what that means when selecting samples while fully zoomed out gets complicated, since 1pixel = many samples)
The sounds aren’t great, and I couldn’t figure out how to load new ones, so didn’t spend very long with it.
All the ‘bells and whistles’ of MIDI mapping, OSC, and JACK seem kind of pointless given how little the app does. I don’t know what would be useful to MIDI map in there.
File | New, select a folder of sounds, click Run… (and wait for a bit, but it’s not too slow).
1 Like
Just looking at the codebase, it seems quite simple what they have done. Python backend with an OpenFrameworks front end.
I intended to make a post here a while ago about dimensionality reduction in what I have been doing lately, so I have some thoughts on their process which they describe here.
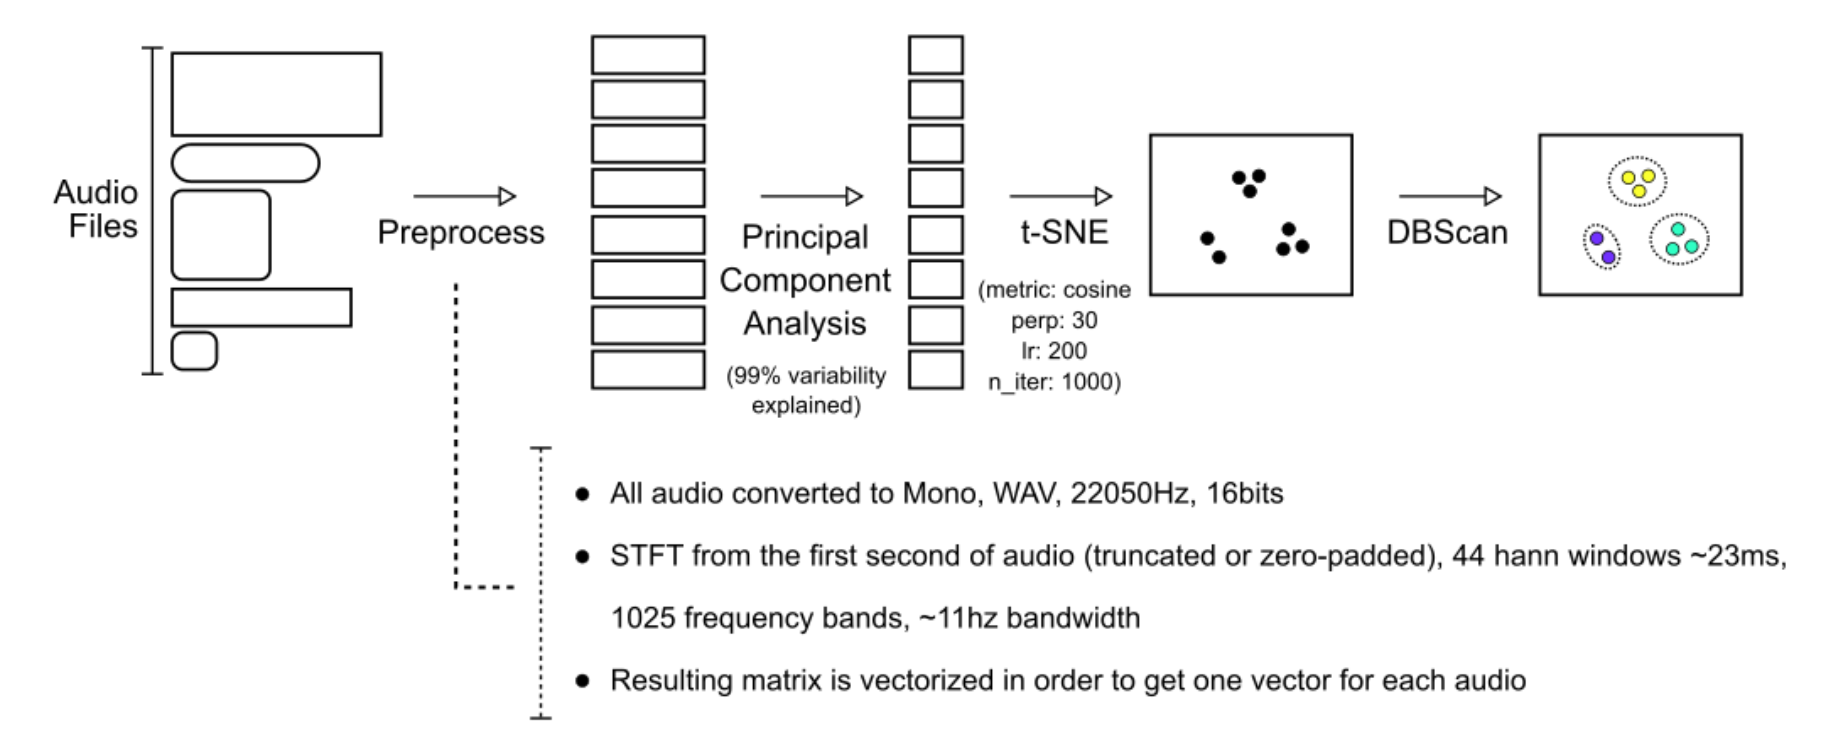
Are they just using raw STFT data for each sound file then (and only a fixed length at the start)? That seems like a massive issue with how the sounds will be clustered. In the FluidSCMap (or whatever its called) I know that @weefuzzy, @groma, @tremblap used an autoencoder to take down the dimensionality of some raw spectrum data, which is then passed to a dim-reduc algo of some description (t-SNE, umap, isomap as described in the paper). With their technique surely they are heavily biased towards sounds where all the ‘stuff’ happens at the start? I would think that taking some sort of time agnostic statistic would be far more successful, while also removing most of the need to reduce, what I assume is, a lot of data going to the t-SNE. I am curious what other people who have worked with dim-reduction think.
I have not checked their paper yet, but note that there are two complimentary reduction steps here, PCA and t-sne, both applied to the whole dataset I presume, so the PCA step gets rid of anything that is statistically not relevant. The flattening-spectrogtram-to-one-vector thing is kind of more intriguing to me.
1 Like
yes, sorry that is another interesting part which I forgot to pick up on.
Is it possible they do another dimensionality reduction in the preprocessing stage to a dimension which is 1xN?
You have the option of MFCC as well
(and only a fixed length at the start)?
That does seem to be true, from a cursory look at the code. Presumably on the basis of computation time, and maybe the assumption of shortish sounds that are well distinguished by the first chunk. The default is 3s in the app, which is probably longer than most of the example drum sounds.
Sorry editing this answer. @jamesbradbury I thought your issue was the use of the raw stft, and that’s why I thought the PCA step was relevant.
So they are assuming sounds are short and therefore they unfold the first 3 seconds into a massive flat vector of contiguous fft frames. Then pick the relevant dimensions of that within the dataset via PCA and then project non-linearly to 2D via t-sne.
And the DB-scan clustering does the colors
1 Like
Got it, seems like an approach I’d like to try and recreate sometime. I’d have to read the paper too to try and understand the rationale behind it.
1 Like
ok I’m trying it on the same dataset, and here are my comments, verbose, so you can comment back!
- first impression:
- nice looking
- good simple (cliché) demo
- clear interface upon making a new corpus (I skipped the tutorial altogether to see how ‘intuitive’ it was)
So I decided to make a direct comparison with the modular dataset we used for @groma’s Fluid Corpus Map NIME paper
- irritant - processing 0 files, initializing, does not move at all… caps at 33% cpu, so might be stalled for real. I quit. after restart, it does behave. Their analysis feels slower than FluidCorpusMap but i’ll need to retry. It is definitely slower than CataRT.
- bug: the window zoom is not zooming the space but zooms the click values… reverting to original size helps a bit - clicking on fullscreen make it work (yet does not zoom the space)
- irritant: the sequencer is rolling all the time
- cool: the colour scheme for the interactive clustering with one slider
- sad: I really miss the other drawings I get from other reductions - a single timbral space like this might or might not be inspiring.
So my conclusions: it works relatively well, it is closed enough to be beginner-proof and might entice people to code their own after playing with it and being irritated by someone else’s interface 
An update: I saw the author’s presentation at ICMC21 (which included the ICMC20 papers too), and I was impressed by the various creative modes of playing back the sounds, and the OSC backend that allows querying of clusters and more advanced scripting. The project is really moving forward. It is still a blackbox but quite interesting to see where it goes and what it offers.
It was a good presentation…and one of the few that actually sounded good as well.
Is it online anywhere?
the presentation? I presume you can contact the author via the website, they might plan (like I do for ours) to put it online in parallel to the paywall…
I’ll shoot an e-mail to them then.
1 Like