If the same architecture isn’t always converging that’s a sign that it’s struggling with the problem as represented by the data. All the more reason, IMO, to start going through dimension by dimension / chunk by chunk and seeing if you can isolate what is difficult about the mapping in question.
Funnily enough, I’ve been writing about this for a paper this week. PCA is at least semi-interpretable because the PCs are just going to be weighted mixtures of input features and it can be inverted. UMAP ‘dimensions’ just don’t mean anything intrinsic though. Really the only recourse here is to have hold out data, or some way of playing with the network and logging the response. The key here, I think, is to be able to form some opinion of what the output should (roughly) be for a given dimension and have that as a point of comparison. If nothing else, thinking about this might reveal points where you’re asking the model to hard things, like map the same input to different output values depending on some context that isn’t captured by the model.
It behaves the same (or similarly enough) with the same data and hyperparams, it’s more a difference between different settings having an impact that is unparse-able.
This could be me misunderstanding stuff, but wouldn’t training 6d (for example) with certain settings and checking its output be meaningless of going back and adding other dimensions as the network is just doing a whole load of intertwined funny math stuff to create an interconnected network that would not necessarily behave similarly with another dimension added in.
Not to mention the (again, my understanding) issue of scale as using only a few dimensions would potentially drastically change my overall network size, and presumably architecture.
Or is the idea to see if a single dimensions “behaves when regressed at all”, and then going from there?
Yes, the idea of looking at a single dim would be to see if behaves at all, or if there’s something pathological. It might be better to go the other way, and start removing dimensions one by one and see if anything has a dramatic effect.
But also, going the other way, and taking data points out is important too. It may be that some outliers (for example) just make life too difficult for the network. One thing to do, with both your input and output sets, might be to PCA your scaled data to dimensions and just look at the layout of things with fluid.plotter (the pca helpfile has the basic mechanics for this): you might be able to visually identify some outliers, and try removing them (and the corresponding output (resp. input) points).
Another thing to try and inspect visually is the mappings you’re asking the network to learn, by looking at the input vectors next to their respective outputs in a multislider and trying to get a handle on if there seems to be any structure in those relationships. For example, if you have a bunch of similar inputs that map to wildly different outputs, the network may struggle.
Coming back to this now. So is this not possible to do once you’ve read a pre-fit, um, fit?
Basically I’m transformpoint-ing my incoming data, and I’d like to scale/map that onto the corpus space by stretching the incoming robust scaling around. Do I have to massage the corpus itself (slower/bigger)? This would be much more interesting to do on the input side (via transformpoint) as you could then map different incoming streams to different parts of a corpus space.
Ok it looks like rather than saving the fit, I need to save the actual dataset and re-fittransform it on the fly. With my testing set at the moment it’s not slow or laggy, as it’s only around a hundred entries with 8d, but this could be considerably bigger. So if there’s a way to transform an existing fit, that would be ideal. (transform doesn’t seem to do the trick when it comes from a read, pre-computed fit).
Yeah, if you try and do something like this with the Weston example in the “comparing scalers” tab of fluid.robustscale~, it hangs like crazy as you adjust things.
That seems to be much less straightforward for fluid.robustscale~ since changing only the high and low entries in the dict doesn’t do anything. It seems to want the whole internal maths recomputed/stored. Changing any of the individual values in the dict gives me a fluid.robustscale~: Invalid JSON format if it does anything at all.
Is there a way of doing this with fluid.robustscale~?
That’s useful, though I was confused for a while as to why it wasn’t working transform/fittransform, but it obviously works fine on transformpoint.
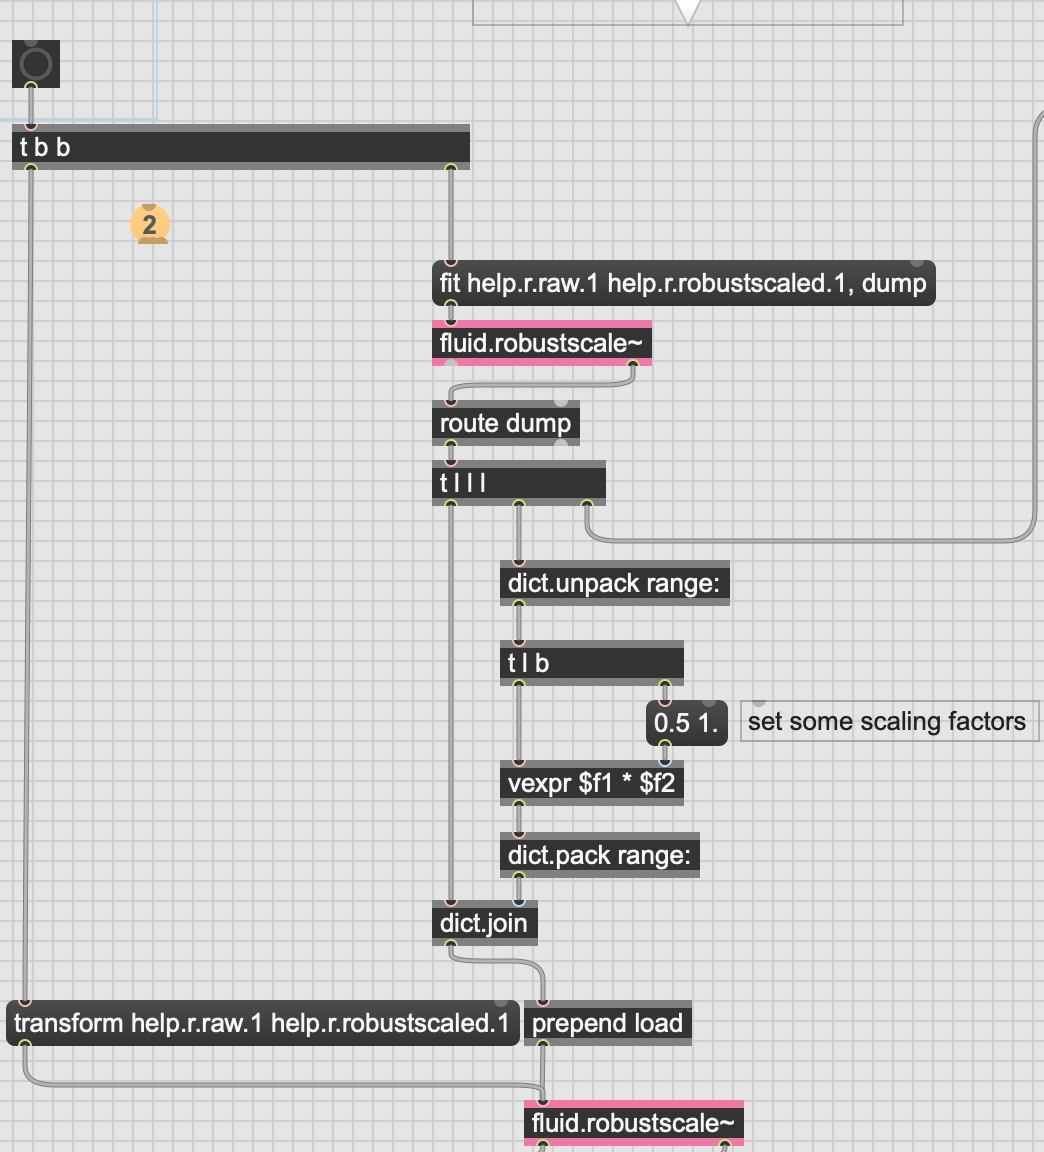
Is it possible, from the output of the dump to redo the maths such that you can manipulate the low and high “values” directly? I was having a good time with an rslider and low/high in my testing, and moving the whole IQR-ing around this way. I can unpack the whole range: key and then vexpr it to scale it up and down, but since it’s based on whatever the initial low/high/ values are, I don’t know how much to scale “up” in this way.
Like in my test example, if I set fluid.robustscale~ to @low 25 @high 75 I get a range (in my first column) of 15.49, whereas if I do @low 0 @high 100 I instead get 62.26. Will that difference there be a function of what 25/75 is of the data_high and data_low keys?
In short, it would be nice to massage the values around in the way I can by messing with low/high-ish input/control, rather than unpacking and math-ing it up (if possible).
I don’t quite get what you’re asking or what maths would need to be redone. I thought the point was just to tweak the ranges so that you’re effectively biasing some distance based calculation downstream to favour some dimensions over others?
transform and transformpoint would then both work with the new range, but anything invoking fit wouldn’t because that implies recalculating the range anyway. I guess the assumption of abusing a scaler in this way is that you’ve already selected the scaler you did, and set parameters like low and high based on reasoning about your input data, and this shouldn’t have much bearing on this trick. e.g. if you’ve set low and high to particular things, that’s saying you believe that points outside those quantiles are outliers and shouldn’t contribute to the estimate of the overall scale for that dimension.
So, I’m imagining you’d do something like this (hacked on the help file):
Basically trying to move the whole of the dataset (and more importantly, the subsequent fit) around.
All of this starts getting very brain bend-y, but in this case trying to move the whole matching space around, rather than the overall size/impact of it around the middle (of the incoming querying).
I don’t quite follow how applying the same transformation to every dimension would get you biasing in the sense of weighting, but it sounds like you’re trying to do something else?
If you want to shift the whole scaling for some reason, then you can adjust the median instead of the range?
Ah right. In this case there will be 8d that are untouched, and a separate 8d that will run through this process (hence wanting to smush them all down) so when I concatenate them, the first 8d have more weight than the second 8d. I guess the same could be done by concatenating first and then applying bespoke weights to each dimension.
Tangential comment/question. This seems super useful, and doesn’t seem to really exist in the documentation (as to what key:s can be modified etc…). With that being said, how does fluid.kdtree~ handle zeroed out columns in a nearest a distance query? More specifically, could I potentially shove a ton of dimensions into the fluid.kdtree~ and then zero out things I don’t want queried at all? (thinking specifically of including stuff like duration/metadata where I don’t want to query on that all the time, but sometimes I might).
I thought about that, but since the medians are in the middle of a descriptor range, I don’t know how I would uniformly move it up/down without knowing the overall range and low/high (hence my earlier comment about “running the maths on the whole thing”). It’s not like I can do the same vexpr $f1 * 0.5 @scalarmode 1 thing there.
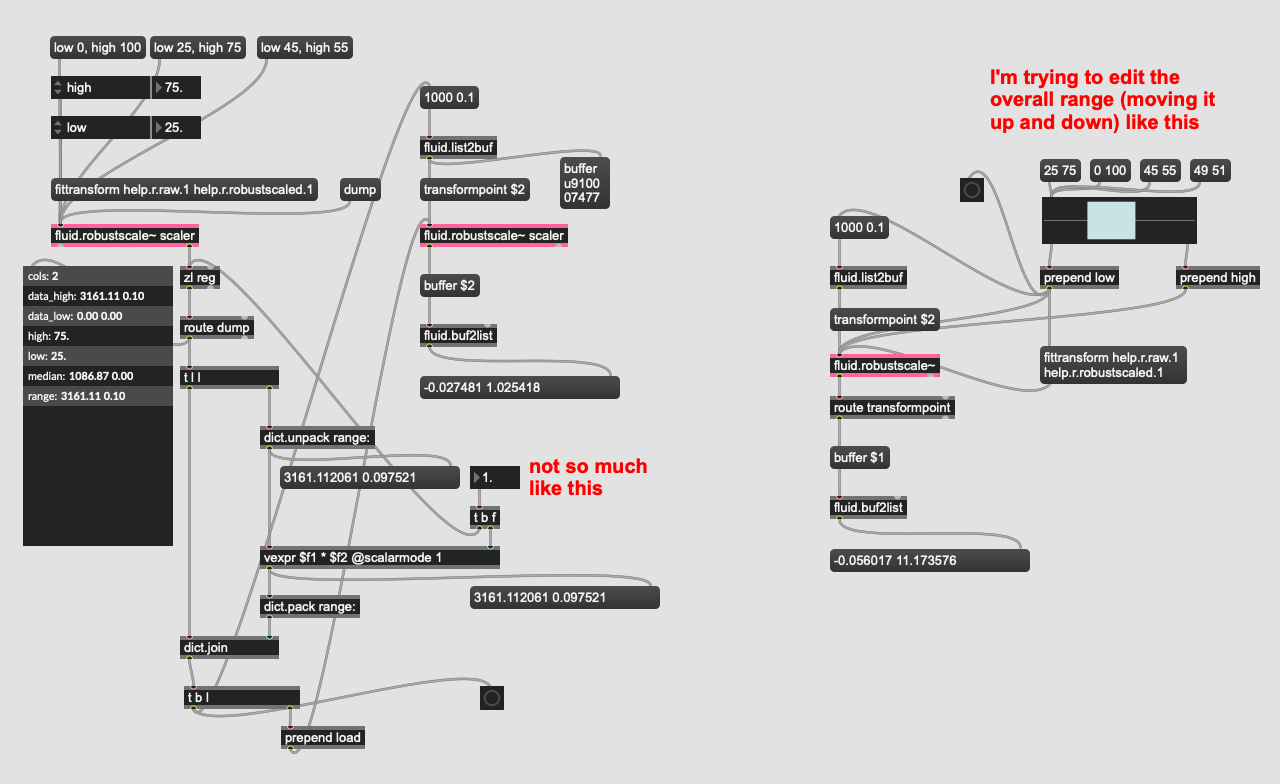
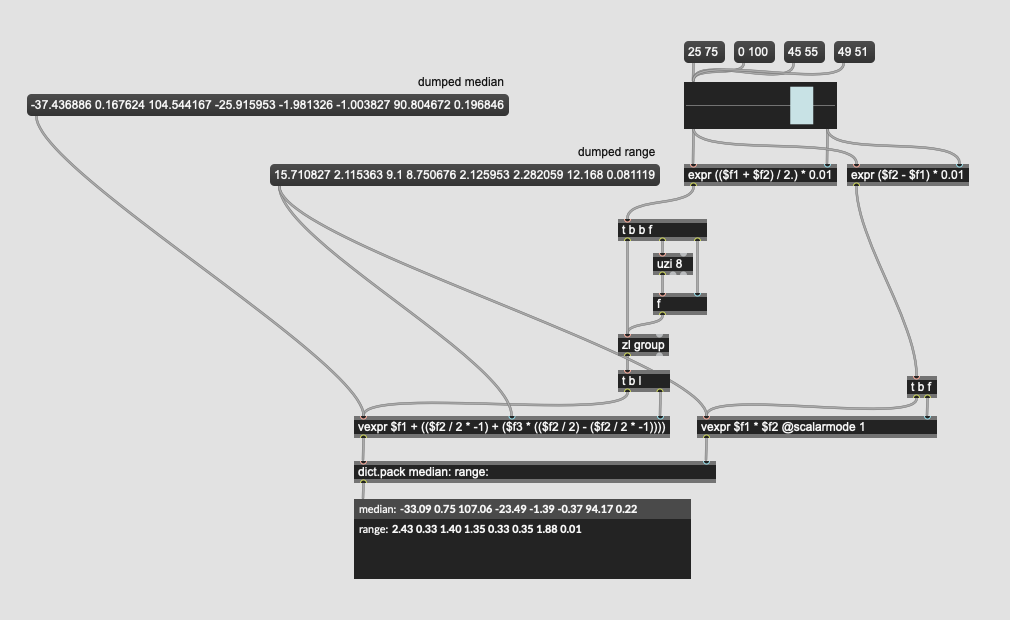
Ok, took a bit of brain juice, but I got something that (I think) behaves the way I was describing. I’m sure there’s (significantly) more elegant ways to do this but:
I don’t know if rslider is the interface I want for this, but it’s been useful to kind of visualize stuff (although I guess in terms of perception, I want to invert the “range” multiplier as having a smaller range here, means the matching is much wider).
Circling back around to this as I finally got a predictive/regressor thing working(!). I do want to scale the relative weight of the predicted numbers however, so in poking at the median/range of fluid.robustscale~ it appears that I need to make the range bigger if I want to make the scaled values smaller, is that correct?
As in, when I load a pre-computed fit (with default fluid.robustscale~ settings) I get the following values for the “predicted” chunk: -0.437787 0.046657 -0.787221 -1.232852 -0.452813 -1.313918 -1.477724 0.979878
The corresponding range values in the dict are: [ 0.226791373532022, 0.241306394821691, 0.24863187572806, 0.256318083066658, 0.161912871499949, 0.319716150836466, 0.222930743839269, 0.127498257225214 ]
I would have thought that I’d want to make the range smaller to get smaller values out, but it appears to be the opposite.
If I multiply the range by 2 to get: [ 0.453582747064045, 0.482612789643381, 0.49726375145612, 0.512636166133316, 0.323825742999897, 0.639432301672933, 0.445861487678539, 0.254996514450429 ]
I then get the following results out of the same point: -0.218894 0.023329 -0.39361 -0.616426 -0.226407 -0.656959 -0.738862 0.489939
Is that correct?
It’s just a weird byproduct of using the “scaling of a space” to try and control the “weight of a parameter” as those are conceptually different things even though you can do one to get the other. Even with that rslider stuff I posted a few weeks ago, I can hear the impact and see the numbers move, but it’s conceptually very difficult to understand what impact the changes I’m making are doing (mathematically).