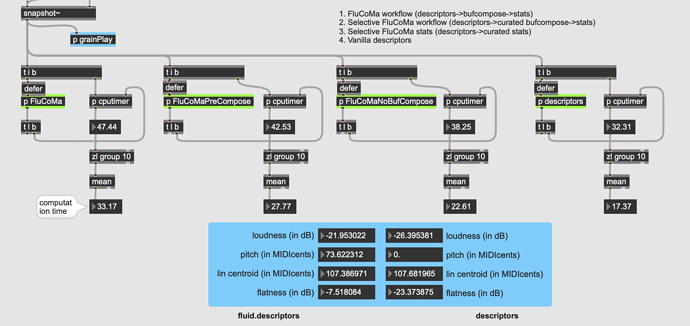
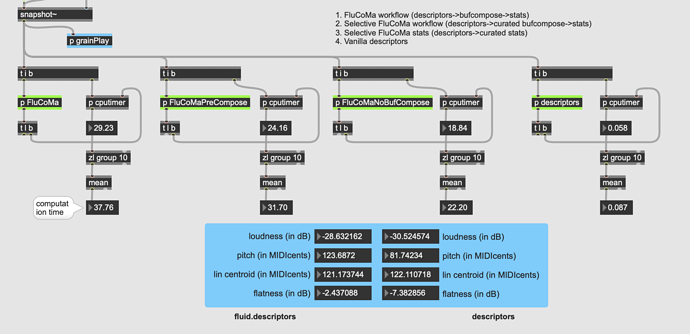
on my todo list for tomorrow to test. Depending on @rodrigo.constanzo I might do an alpha07a release, or wait a week or so to alpha08.
Nice!
I don’t mind waiting a week, so unless something else big gets fixed don’t bother with an alpha07a.
A semi tangential question.
Is the speed difference I’m seeing with and without deferlow likely to correspond with a real-world loss of speed or is it more about how the scheduler is calculating time?
I would think the latter. The internal process is already defer'ed, so there should be (computationally) no difference with and without, afaik. @a.harker might know better.
Ah right, so that’s specific to this object and the fact that it is defer-ing internally either way.
But say I had another process/object that showed different timing like this. If it, theoretically/hypothetically wasn’t defering anything, the real-world difference in computation time would be what cpuclock is reporting?
Um - defer is not deferlow. Deferlow puts things at the back of the queue, meaning that anything else in the queue is serviced first, so although I haven’t checked the patch defer low can produce real differences in when you get a result (but not the actual calculation speed).
Durp, yes. Back to reading comprehension class for me
Wait, I’m confused again.
I guess what I was trying to ask is that cputimer reports 0.5ms with deferlow and 5ms without it. My question I guess is more about cputimer in relation to defer'd processes in that is the “real world” time it takes to do the process 5ms regardless of whether or not deferlow is used, and cputimer gets caught up in the whole threading thing or is it actually faster to use deferlow in a context like this?
Assuming you have overdrive on, then your cpuclock is also reporting on the time to switch between threads, I guess.
-
snapshot~outputs on the scheduler thread -
deferanddeferlowwill bounce things back to the main thread - in your patch (without
deferlow), the starting bang is on the scheduler thread, the ending bang is back on the main thread, and this will add something to the reported time (how much depends on what else is going on). - Presumably, the lack of any difference for the timings from
descriptorsmeans that it always runs in the thread it’s called from (@a.harker true?)
Your description of what is happening is correct, but to my mind the figure that matters is “how long from when I set the process in motion to when I get the answer” and it sounds like this is what is being reported.
descriptors~ does not defer because it is only reading from buffer`s and not resizing them, which is a key reason in the flu coma structures to defer.
Ah - wait!
I hadn’t looked at the patch. Owen’s description/analysis is correct. So - the issue is the placement of the deferlow. If you start the timer on the snapshot before the deferlow you’ll get answers that make more sense. The way it’s patched right now you don’t measure the time between the snapshot output and the start of the deferred process, so actually what I said in my last post was wrong - you aren’t measuring the thing you want.
You also shouldn’t need a defer low - defer will be fine.
So - sorry to clarify you need a defer(low) per object so you can get what you want. the defer should happen after the trigger before the processing.
Run this patch and do other things in the background (run rod’s patch/resize the window/etc.).
You’ll see how terrible the deferring process time can be depending on what is happening in the main thread. Not great for real time.
----------begin_max5_patcher----------
1135.3oc4XssiihCD8YxWgEOmoEWyk8oc+NFsJx.NocOFajsISlcz7uu9FDf
.Ljt6zaKs8CA0UY6ppScyt94JO+L1EjvG7GfuB7794JOOCIMAO2+64WBujSf
Byx7onuyxdweskkDcQZHWfNh3MTo0krZIAIMaIzQEWXVoZ2eItYk1kI+QExp
C99f+1wpBJyeFSOcfixkVtQA6eJXMHbWr9S7F8uQQOEztGkfwzV4po8qUqz+
r9sYcRPFHabqK5VqKZRqKCRO4u18cNKMbSpwRSL1XbzGlkVhjbFHMH.7mvbI
9LBDtXuZ3718Rr2vX6m8yavQuBC9HgoNi4chUPNTg.H9ADElQLpevHF59oie
uw6djQkB7+XVPn1Q96.gnTi0mda3s9nnJEznH+EGCI9sb3kPywr4AGfTAxqp
k3x6HaOZ5.CkSQq1udrJJP+o4eVDV0ORpqHT1jEOb.h5TvDzYDWfYzNFmmOr
ppCYuNaQihuvLGzt0sjvTKofVRbzYby9iZoB4JCUprxZtUyurIw+5wvJPbZM
t0kZ7mNUx34zVrnBla2r1A2v9JzkFYy01YppDteqA6h2dE7TgFmHr7ugJ5py
9rJDESq3HAhJgRmx2xV0B.VSjG54DCeJceZ3tM6a9arUezovidTi5D87OwwE
LpVk54XzjaDtJJwZoocMMyJnvpQ1rJXUgRSvTnL4ZQFjq8atZCMNNeIiQ5yp
ceDzQoicElRGfoRV0zL43SOOydyXJlkyc1FNhC0TK2CpPD4AA7bezVBIDW1d
+i+BjhUkUP5zci4FzxzVe7YQNmQH8rWKmyivoPExmi9NtP9rQPO0weqVNtpI
jxu0KWfOgDx9zjvSh9TDxeXA8NjpybozGjnxJhxJ5ufdW7oa9a25h8nOn9ns
VVax4MEBC5vYjljSUXKNwDxtM11Jn42132aqs2gQNqrTkaZDFlp5icFR.XJn
T.vB.GUw3RTAPgJntpAlVftzonhqWgq9xqDe50+neOjLP3z3V333VT2cL+EL
tsUxTUglp4Rfol31cFz2VeLXfOX5RSi288wipp9x45p12MzFOKz1uE86E1FF
jz4RNe9A2unJWc2.axGIv5JbjD6dwP5aCWi97VJH8CrTPxt+OUIXyGY.axVc
L5mxBAlS8tQusyhd8AtoqLlrcoc9ClnyuNC.HT2rT.T2bSID.jV359qtHf6d
AidAfn+yAwc2Yx8j4rua3HTiZNfbVvarHvqu6ffoScgSiMn4ONpJX077FDvg
Qf91i5BzRLs8MYessPodcKxmdu5v1EpCQOPcXyB0AUeXP3CRGRWnNr4AhCIK
TGBef5P7c3KdT5PzB0g3I0AGwlop3qeqbwA6bAN.kRNNqVZSi6Nln658qKa9
HmHrLHw8F11Vfi7H3UWMA2D9LHP+5M1A9MDOci8ade4T40gWSptYxhKUPQ1y
XVA0wY8ljyhLn2pfBWhfdOLnkHH8XpGHIanwfoWpExfoVNXhk2NsxomT4voT
ZxklZ5jq90p+Et1kt9A
-----------end_max5_patcher-----------
Ok, so based on that this is what I get.
With defer in the "correct’ place:
This gives me wild values for everything, including descriptors~. It also gives me really high values for the fluid. stuff too, whereas before I was getting circa 5-7ms per process.
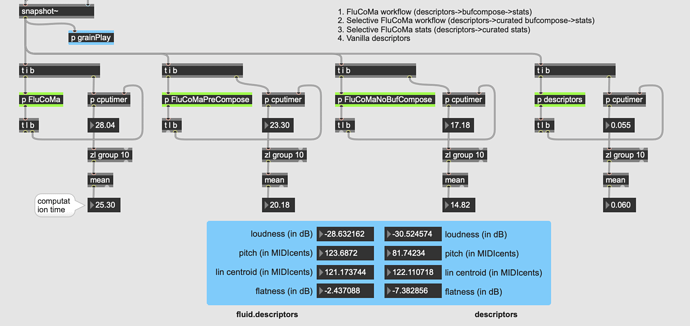
No defer at all:
The descriptors~ is back to its speedy form, but the fluid. objects stay really slow.
So I guess the 5ms time I was getting from the fluid. examples were false reporting due to the deferlow being in the wrong place?
And in “reality” the fluid. stuff is around 500x slower? (in alpha07 anyways).
Ok, and some bad news.
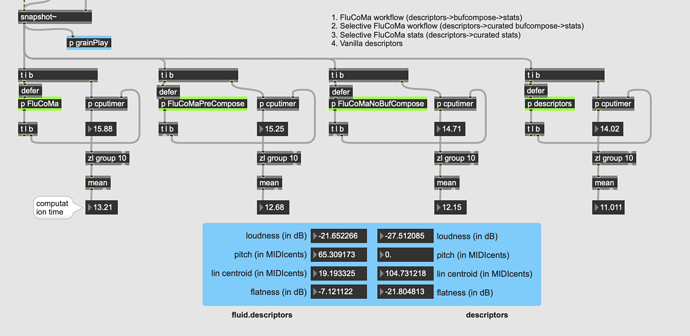
Here is the same comparison, using alpha06.
With defer in the correct place:
Everything is slow (but faster than in alpha07).
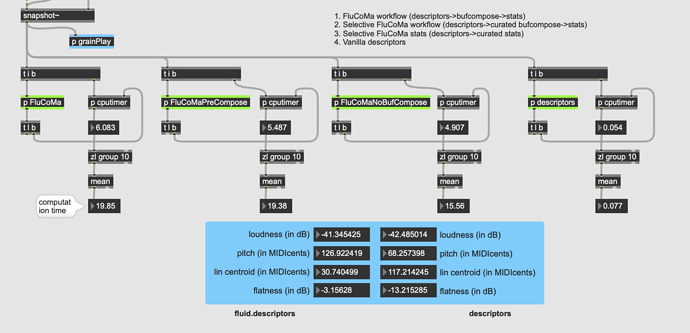
Without defer (had to run this a few times until it didn’t crash):
So even in the fast alpha06, fluid.descriptors is 200-300x slower…
No, because you’re still including the time to switch threads in that measurement, which will depend on what else the main thread is doing (in this instance, quite a lot). As such, you need to distinguish between the intrinsic speed difference between your aggregated fluid. processes and descriptors~ (which we think is ~8-10x in this mode of operation), and the operational difference when using these things as quasi real-time objects. Clearly, the latter is what concerns you, but your statement is about the former (or seems to be).
The distinction matters because they have completely different solutions. The intrinsic difference would be addressed by profiling and optimising the algorithm itself, including assessing the actual overhead incurred by multiple STFTs. The latter would be addressed by making the objects safe to run in the scheduler thread, viz. not attempting to resize buffers. Given that this would render some objects useless, it would have to be some sort of option (if it ever happened), and could complicate usage somewhat (by introducing surprising behaviour).
Hmm, if I understand you correctly, you mean that because there’s a lot of fluid.descriptors stuff happening in my patch, that makes things slower overall?
Here’s the comparison between having one vs many.
All processes:
Leftmost one is about 38ms per round of analysis.
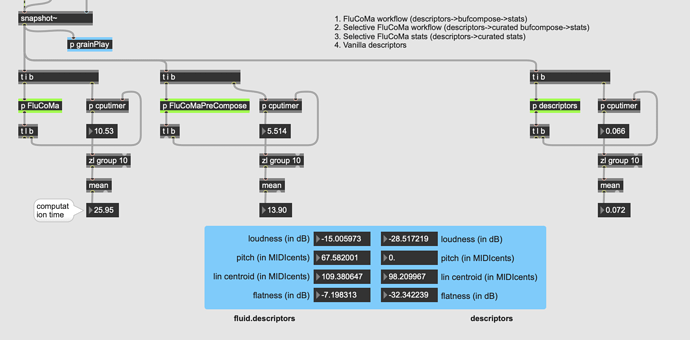
One process removed:
Comes down to about 25ms.
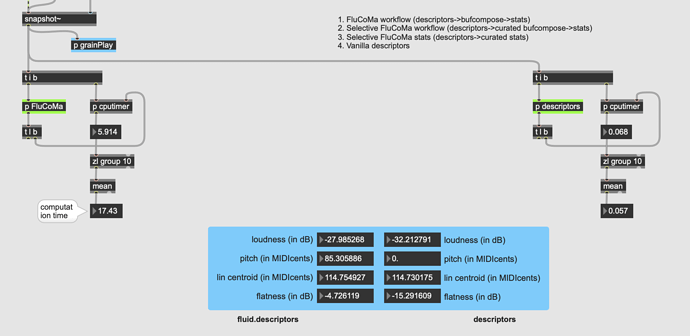
Just one process:
Down to about 17ms.
Still in the >200x slower range though.
In a practical context, there will likely be loads more stuff going on in the patch that this comparison, so I don’t really think I’d have a stripped back version of it like in this example.
It could also be that I further/additionally misunderstand in that all of the fluid. are internally defer-ing in the same way, so having a bunch of those happening at once in the same patch is the culprit.
OR I just completely misunderstood what you meant.
Lastly, the 0.5ms speed I got from the fluid.descriptors was when I had deferlow in the “wrong” place, so it could be the 8-10x slower number isn’t accurate at all, hence this line of inquiry.
Not really: it will gum up things a bit on the main thread, but mostly to the detriment of screen refreshes (which always seem to be placed at the back of the queue), rather than fluid processes, which are placed at the front.
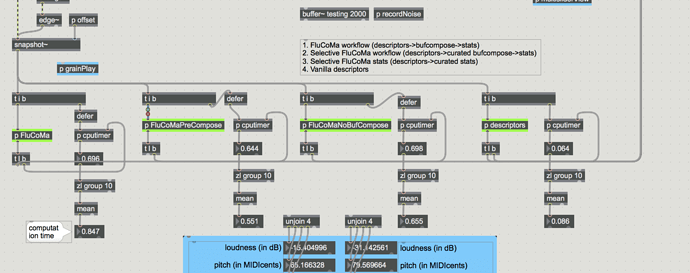
All the screenshots you just posted show the time for a thread switch + the fluid processing. Below, I have deferred each bang that starts the timer, so what you are now measuring is the time between kicking off the fluid stuff and it finishing, without taking the thread switch in to account. (ignore the unplugged grainPlay, it makes no difference)
You’ll see we’re back where we were (although I note with all the blocks plugged in, there are a lot of outliers in the fluid timings.) This is what I was getting at by distinguishing between an intrinsic difference (i.e. the difference in actual processing time) vs operational (i.e. having to take the thread switch into account).
What this whole discussion suggests to me is that in an ideal world our non-realtime objects would happily support three quite distinct contexts of usage in Max:
- Heavy processing, it’s done when it’s done → delegate to new threads
- Medium processing, non-critical timing → run on main thread, without fear of gumming up max: this is what we currently have
- Light processing, critical timing → run on scheduler thread when available
Work is well under way towards adding support for the first of these. The third, as I said, is tricky, because it just wouldn’t make sense for a number of the non realtime objects not to be able to resize destination buffers.
Ah ok, I understand the intrinsic vs operational thing now.
The operational difference is what I meant with the whole “real-world” stuff, as the intrinsic speed, although handy, doesn’t tell the whole story.
I do like the idea of having multiple contexts, but it strikes me that so much of that appears to be having to jump hoops to avoid the core paradigm(/problem?) of ‘everything is a buffer’.
Because you have to go in/out buffers to manage the data between processes, it makes threading a problematic/contentious issue. Which makes sense if you are working with audio that natively lives in buffers, but that isn’t the case here. The buffer is just being bent to work as a data container, which brings lots of problems with it.
Although I haven’t mocked up a proper example of my intended use case, but I am hoping to do “real-time” sample playback via onset descriptor analysis, so already taking on a 512sample (11ms) delay between my attack and a sample being played back is knocking on the door of perception. Tacking on another 1ms to that doesn’t help, but if the operational (“real world”) delay/latency there is upwards of 20-40ms, this approach (with fluid. objects anyways) becomes impossible/impractical.
Now as @tremblap mentioned, I could always use @a.harker’s vanilla descriptors~ in this context (which I will/would do, though there is some funky behavior as can be seen in the comparison patch above), but I do like a lot of what the fluid.descriptors objects bring ot the table. Plus, this sort of idea will make up the core of real-time matching/replacement/resynthesis in the future, with the 2nd toolbox. So this isn’t a problem that is unique to my intended use case, it appears to be a problem that will be present in many use cases (that at all involve real-time applications).
So this circles back to the core architecture/paradigm decisions, and how they impact scalability and application in “real world patches”, similar to what @jamesbradbury is going through with his patch trying to analyze multiple slices from an audio file. A seemingly simple use case, which brings with it a massive amount of overhead and conceptualizing due to how things are structured.
Not in this particular instance, no. (this phrase might be a refrain throughout the following ![]() ) You have two separate gripes, and given that they have different solutions, it’s still important to keep them distinct. ‘Real-world’ here means using these objects in real-time, with overdrive enabled because you want tight timing from Max. That throws up considerations that are quite distinct from, say, large scale offline processing.
) You have two separate gripes, and given that they have different solutions, it’s still important to keep them distinct. ‘Real-world’ here means using these objects in real-time, with overdrive enabled because you want tight timing from Max. That throws up considerations that are quite distinct from, say, large scale offline processing.
Respectfully, that wasn’t so much an idea as a statement of the possible roles our non-realtime objects play. I think we differ on how much of a mainstream use pattern using such things as real-time with high timing expectations might be, but I was trying to indicate that it is a use pattern we take seriously, whilst emphasising that there are others that we also have to support.
Using buffers like this is trading off one set of difficulties for another. On the upside, they are accessible from every ‘domain’ in all our host environments (i.e. messages, signals and jitter in Max), and they scale well. Part of the experiment here is to try and develop a more approachable paradigm; descriptors is powerful, but very complex to use, likewise MuBu .
Meanwhile, of course, figuring out if that set of upsides is worth it relative to the varied kinds of thing we want to do in practice is exactly the collective work we’re engaged in here. That will involve some head banging, inevitably, and clearly part of that work is developing the right kinds of supporting scaffolding to make things simple: knowing what those things are (or might be), and what counts as simple is exactly the kind of discoveries that come from actually using the things in their raw-ish state, like this. Of course, it may be that it can’t be made to work in the end, and we have to go back to the drawing board, but I feel it’s still somewhat early to consider junking the whole set of design decisions just because we don’t (yet) have the abstractions needed to make work completely painless.
This feels like a different set of problems, to do with performance rather than ergonomics. The first thing to note is that, irrespective of the particular toolset, you’re asking a great deal of any machine listening system to try achieve analysis and response within a perceptual fusion window (although I think you’re pessimistic about how short that window is for audiences in halls, rather than critically listening drummers). We’ve discovered that transitioning between the scheduler and main thread is adding considerbly more overhead than the process itself. This would tempt me to simply turn off overdrive in this particular case, although I acknowledge that this decreases timing certainty in general.
It will be an aspect of toolbox 2, but there are many other things to consider there (including developing a quickly-query-able data structure). Real-time is challenging in this particular case of analysing different sized chunks of buffer on the fly for features and statistical summaries, but rather than signalling the awfulness of the buf versions of the objects, it could point to the desirability of adding a new behaviour to the signal rate ones (e.g. a fluid.stats~ that outputs summary statisics between clicks in a secondary inlet; being able to choose (in Max) between signal and list outlets for certain control objects, etc.)
Yeah totally. I don’t want to seem like I’m (needlessly (and superfluously)) busting balls here. I’m just pushing at the edges of the existing paradigm/architecture, and offering thoughts and solutions(/problems?) as to how it can be made to work better.
There are lots of decisions that I don’t understand, but I’m rolling with it and trying to build the things I want to work with it, but that doesn’t always lead to somewhere that “works”. [So far, almost every avenue of exploration has led to a dead end (barring the CV thing, which I want to explore further still). That’s ok. I’m still playing and learning the tools.]
They scale in length, but not quantity. You can have an arbitrarily long buffer, but you can’t have (without great hassle and messiness) an arbitrary amount of buffers. Sure, you can use a single ‘container’ buffer and bufcompose~ everything into it, but then you need a secondary data structure, for your primary data structure, to know what was where in the mega-buffer.
It’s not worth beating on that drum for too long/hard though, as my thoughts on the buffer-as-data-container are well known at this point!
Indeed, but I’m not worried about the listeners (nor halls with listeners in them!), it’s my playing and “feel” that I’m concerned with. If it hit a drum and then get a sample playing back 20-40ms later, it doesn’t make performative sense. 11ms (or rather, 512 samples) is a “happy middle ground” where I can still feel/hear it, but it would be worth it if it worked well and was more accurate, hence my resistance in this thread to anything that would be slower than that.
In the future, once there are (more sophisticated) querying/playback tools, I’ll probably do something ala multiconvolve~ where I analyze 64samples (maybe even 32), then play back a transient that matches that immediately, while I am then analyzing the next size up, and play the ‘post-transient’ from another sample, then the next bit onward, etc… “stitching” together a sample as quickly as possible, and as accurately as possible. That would be an ideal implementation for this idea/use case.
So even with a multiconvolve~ approach, the first tiny “transient” analysis window could still take the intrinsic latency + the operational latency, regardless of how tiny the window was (32 samples + 20-40ms?).
That would be fantastic. I don’t know what that would mean in terms of analyzing a specific (sample accurate) onset (window) though. Plus you lose all the time series info, and potentially run into syncing problems between the different fluid.descriptors objects as well.
It seems like, fundamentally, I’m in between the buf and the realtime objects, in a way that neither is built for the use case(s) that I’m looking at.
