Edge cases in analysis frames

What’s surprising is the highest output (here) is in the middle of the overall analysis window, where the sharpest spike is happening at the start.

Actually, looking at the tiny fragment of audio (256 samples), it doesn’t show much of a morphology:

So this is, I guess, the tiny start of what I drew out. And the contour I’m seeing is probably “correct” in terms of perceptual expectation (like a 2ms “onset”).

I can go for a time-domain thing, for loudness, but the benefit of this would be having it time-aligned with other descriptors for the same window of time. So at x point in time, the loudness/centroid/etc… where [list of values]. I could S&H a time-based envelope follower, but that’d still leave me in a similar boat for spectral analysis. Though folding may be useful there.

I haven’t yet tried smaller hop size (I’m presently using @fftsettings 256 64 512), but I feel like I’m nearest the squeezing water from a rock point with such a tiny analysis window.

I can, perhaps, push this kind of “envelope extraction” onto the predicted analysis stuff, where I’ll (hopefully) have 100ms of audio to analyze. What a luxury!

If you are analysing 256 samples only with a window of 256 samples an a hop of 64 then you would be almost totally guaranteed to have the largest value for the central analysis frame (the one that entirely lines up with the audio), whatever the shape of the audio (for a rectangular window it would always be true, for other shapes there are probably some edge cases).

1 Like

I’ve got lost somewhere in this: you’re talking about fluid.loudness, yes? But this isn’t a spectral-frame based process: it’s a windowed time domain algorithm.

IAC, you might be better off taking the peak-per-window if it’s those sharp little moments you’re after.

1 Like

I did pivot to loudness there, though I guess the same thinking applies to fluid.spectralshape~.

By that last bit, do you mean manually (programmatically) reading through each window/hop to pull a peak value out?

I was wondering about this, but my brain got lost with all the other flip/mirror/hops going on in this thread. Fundamentally, the frame-based processes across the fluid.object~ take a mean of each window of analysis, and then you typically compute an aggregate stat of those core means. Is it a thing to have a different base statistic going on, for descriptors? Like if I want the peak-per-window, as you’re saying here. Or maybe max-per-window, though I guess that makes less sense in a spectral context.

The effects of zero padding will be quite different, because there’s no FFT (so discontinuities don’t smear in the same way)

The second output of fluid.loudness is the peak in the window

I don’t know how useful it is to consider any frame-wise process as simply delivering a mean across the span of the window, because it really depends on the algorithm (e.g. in HPSS you’re definitely not getting a mean, as such).

Ah right! Handy.

I always read that to be another loudness measure variant “true-peak™”. Will check stuff and see how that looks.

edit:
unrelated, but getting this spammed in my window which I’ve never seen before. This is with the fluid.bufloudness~ helpfile:

fluid.bufloudness~: maxWindowSize value (17640) adjusted to power of two (32768)

Alright, this is pretty useful.

Since it’s also a peak, the zero-padding doesn’t matter, so having a larger window for the larger window makes no difference (as far as I can tell). The envelope is also a bit in line with expectations.

Here are a couple random attacks showing all three for comparison:
Screenshot 2020-10-28 at 1.30.30 pm

Screenshot 2020-10-28 at 1.30.16 pm

Screenshot 2020-10-28 at 1.28.46 pm

Screenshot 2020-10-28 at 1.30.08 pm

As an aside, I know one can do whatever they want, but is there a perceptual/theoretical reason why picking peaks like this isn’t useful? As in, if I do the same for offline/realtime (target/source), does it matter?

Or should I still use the mean’d version in that context, but instead pull out peaks like this if I’m trying to generate contours/envelopes?

Perhaps not surprisingly, this “envelope extraction” works better on longer stretches of audio.

Here is 100ms windows (my longer “predicted” bit of analysis). At the moment I’m using the same analysis/fft settings (256 64 512), but with a larger overall analysis window (4410).

In this context, I think the mean-per-frame is better than the peak-per-frame. Also with so many frames, I think the overall gesture/contour is the same, with the peak version just being a bit step-ier.

What’s also somewhat surprising is how the centroid behaves over time. I expected a bit more of a rolloff or some kind of change over that analysis window, but it appears to be largely flat. I checked other spectral descriptors as well (not massively thoroughly), but most show similar (lack of) contours. I guess that’s the nature of this being a single “attack” or “moment”, as opposed to some kind of morphology that changes centroid/timbre over time in a more overt way.

There’s also more meat on these bones as well, which could serve well for the kind of contour/envelope analysis discussed in this thread.

I was thinking about this again today for a couple of reasons. One is how having a pipeline-like workflow might be made a bit more complicated if I’m fussy about what frames I’m taking (since I’d have to scale that up/down with the @numframes), but that it’s not always possible with certain types of analysis.

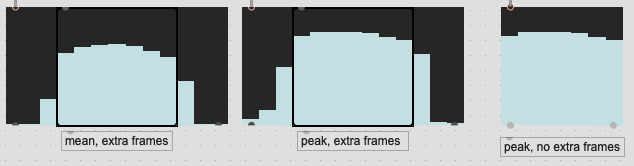
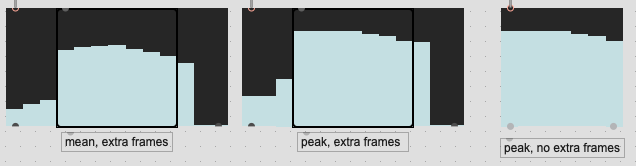
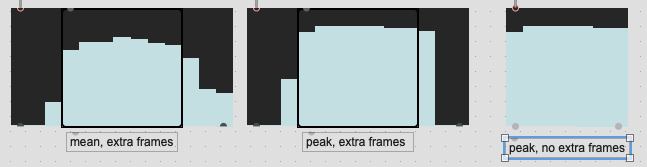
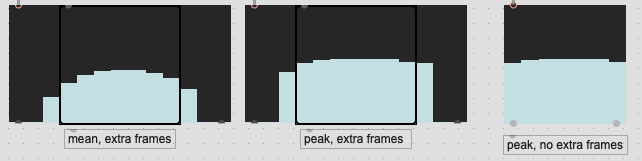
What I’ve been doing for a bit is what I describe above, where if I’m interested in 7 frames of loudness analysis, actually analyzing 13, and pruning down to 7 so that the overlapped area contains “real” information vs being zero padded. In the tests I did above that seemed to produce quite decent (visual) results.

It then hit me this week, while coding up the LTEp thing that I can’t exactly do that with offline file analysis. Or rather, if the files are sliced tightly there is no “real audio” before the start of the file anyways. So for the sake of consistency between descriptors, I’ve since dropped the my semi-“workaround” for the lack of mirrored frames. Bummer, but I think having more consistent matching/parity is more important than one side of the equation being “more correct”.

Somewhat related, although not the exact subject of this thread, is choosing which frames are analyzed. I’ve always done all the frames for loudness, but then only the “middle” frames for spectral/pitch stuff, based on some discussions from the first plenary. Now that we have weighting, I think that somewhat mitigates the possibility of skewing stats around by funny stuff in the edge frames (though not entirely since loudness also gets zero-pulled). That got me thinking about the scalability and reusability of different analysis pipelines. The demo code in the LTEp patch is hardcoded to 256 samples (7 frames with “middle” frames for spectral stuff). If I request a larger amount of frames, my @startframe 3 @numframes 3 thing doesn’t work anymore. I could programmatically have it such that I always ignore the first and last x amount of frames based on the FFT/overlap, but that’s getting a bit fiddly, and has ramifications for buffer sizes down the pipeline, particularly since things like @weights have to be exactly the right size.

So this is half comment and half question in terms of the current thinking or temperature on being selective with the frames you choose to apply stats to within a window vs letting weighting process that for you.

Don’t get me wrong, I still think having a native @edgeframe option would be handy as I think, for short analysis windows in particular, that having mirrored windowing would be ideal, but for now I’m wondering how useful the results are vs the additional faff.