I looked for an online reference to “fluidbufmfcc” to understand some details
but I couldn’t find any, I have a question about what’s happening when I write:
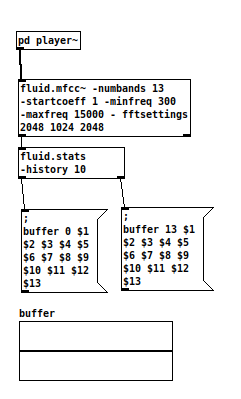
"fluid.bufmfcc 13 -numframes 1024 -numchans -1 -startcoeff 1 -fftsettings 2048 -1 -1 "
I expected the object to return 1 value, as the hopsize = numframes ( =1024)
but it returns 3 values, meaning I was quite wrong about how fftsettings work
So to get only one value, I set the “numframes” to 512, but this value doesn’t match with
my fftwindow.
Can anyone point me at what’s wrong with my reasoning ?
There was a handy tutorial which I can’t seem to find at the moment (@tremblap@weefuzzy ?) called “where is my data” or something like that.
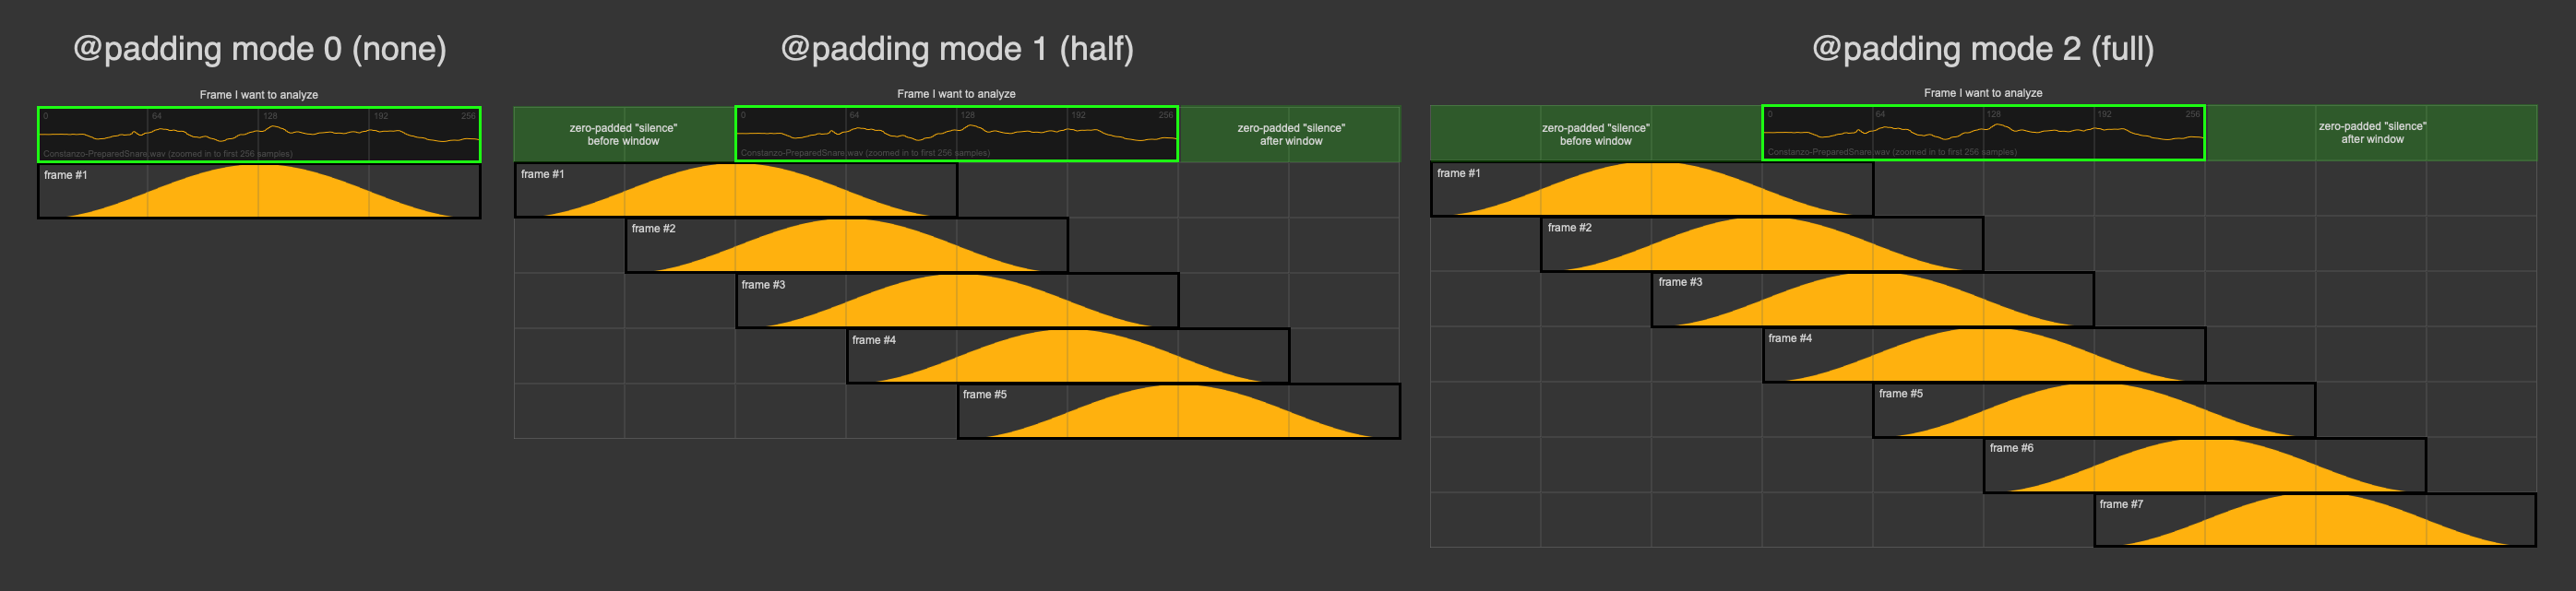
Unless you set @padding to none, you will always get multiple frames of analysis because of how the window size and hops interact. I tend to use @padding 2 (full) which ensures that all hops are analyzed the same exact amount of times, but the default will always start window/hope before the start frame (zero-padding the contents), so you will get multiple frames there.
If you are interested in a single value, you’ll need to use fluid.bufstats~ to then reduce all the individual frames to a mean value (or any other stats you want).
this gave me great results with a kdtree. Though I’m not sure about every details of what’s happening ( maybe I was lucky, doing it wrong )
I’m now analyzing files, instead of real-time audio signal, so I try to “translate” the implementation above into a buffered version, I realize that even after reading documentation about fft there are many things I didn’t get.
I think " fluid.stat -history 10" is wrong ( but the classification works just fine )
Anyway I want to make the classification with buffers now, so I can add other descriptors like ( @rodrigo.constanzo ) you did in your sp-tools.
So the @history attribute is only for the realtime version as it takes a certain amount of frames in the past and averages them (10 in your case). This is similar to what is happening with the overlapping hop/window frames above where the hop to window ratio and @padding mode determine how many frames are in your “history”.
It’s also different in that it’s zero padded whereas the realtime version is always a rolling window.
It’s worth mentioning that for something like classification/matching like you’re talking about in the other thread a rolling window isn’t ideal as an attack or transient can fall anywhere in the rolling window and/or be over or under represented in the @history. There’s not really anything you can do to make sure that’s accurate/tight, which will impact accuracy with whatever descriptors/stats/whatever you are interested in.
Hence my use of the buffer-based versions, even for realtime use (I just query at a fixed interval).
But in general, there is some massaging to go from realtime to buffer-based but still realtime, to fully offline approach, as the interface and settings/considerations for each is a bit different.
oh actually there is a Pd version I need to test. Then do the SC version (if @tedmoore is not jumping on it before I have time) then we can publish this on the website. Would that be helpful?
don’t worry if not a good timing, it was just that I needed to read the docs and do the SC and check the patches so it is up you the standard of ‘learn.flucoma.org’ that you and @jamesbradbury got us used to…
Also put this vizualizing patch together for a tutorial video I’m working on.
Hard-baked for hop = window/4, but useful for seeing what’s included in each frame (I could’ve sworn the “where’s my data patch” had something similar, but it only looks that way because of the pitch confidence rising and falling).
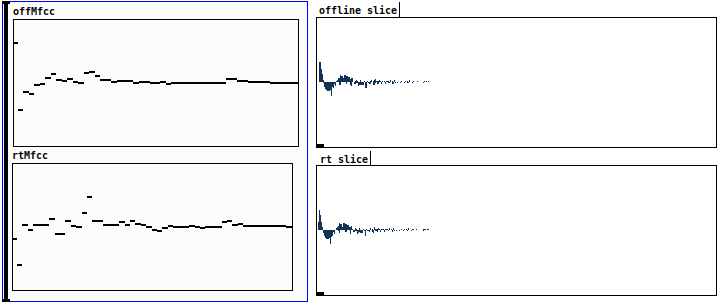
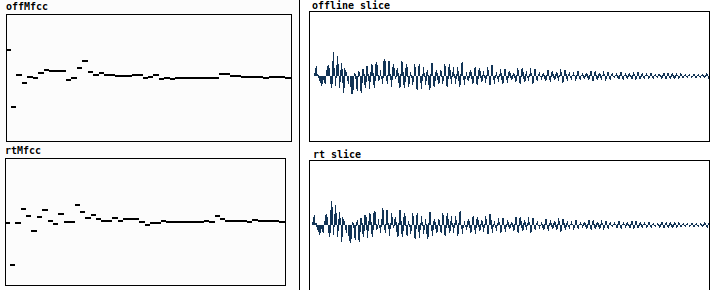
I’m testing a buffered version of my patch , for some reason when I classify a sound that has been used for fitting the kdtree, the buffmfcc analysis has slight variations
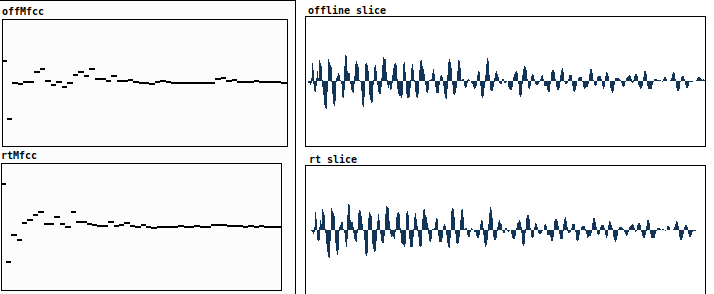
in the following examples, I compared the sample frames & mfcc analysis that were used to fit the kdtree ( offline slices & offMfcc) with those I try to classify ( rt slice & rtMfcc ) . Sometimes 2 identical slices have some coefficients that differ a lot, I’ve been looking in my patch to find errors,
found a lot of imprecisions , fixed them, but there are still variations.
the distance induced in the knearest lookup is never “0” though I (seemingly) use identical frames and identical settings for the mfcc analysis.
Any suggestions for where to look for the cause of these differences ?
Apart from the “blocking” parameter, my " fluidbuf.mfcc" objects use identical settings.
The sample frames have tiny variations on the example, maybe this alone can alter the mfccs ?
I think this is the issue here. With onsets/transients, the position in the analysis in the window can have a substantial impact on the resultant descriptors. MFCCs, it is my understanding, are quite fragile in general, so unless you analyze the exact same frame, you will definitely get different results.