Hi everyone,
I’m working on a project
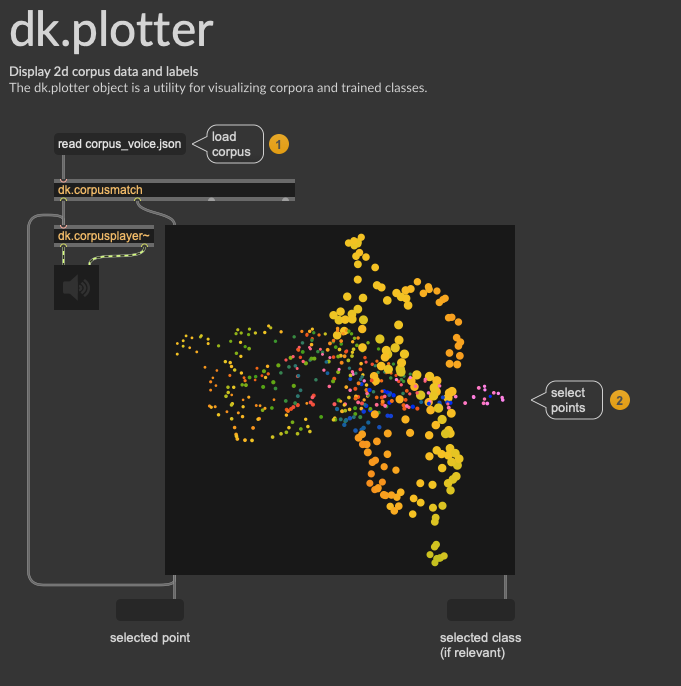
that uses fluid.plotter to visualize audio sample analysis through fluid.bufmfcc, fluid.bufstats and fluid.bufflatten.
I followed the documentation and managed to:
-
Set the background color with bgcolor
-
Modify point colors using pointcolor with specific identifiers
-
Generate random grey gradients for the points
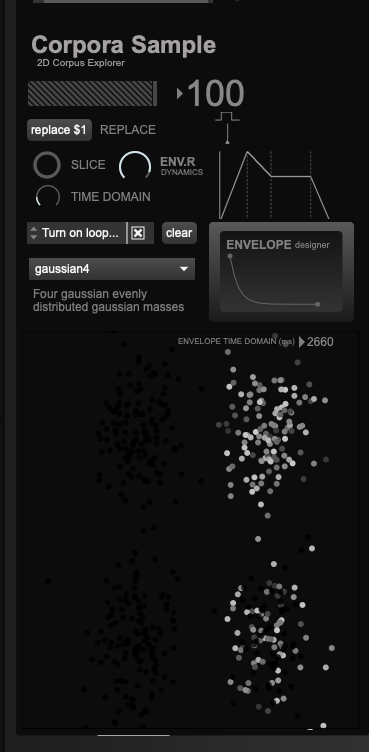
The problem: In my analysis patch (see screenshot), the plotter points always appear black despite having set pointcolor with grey values. I suspect this is related to the classification or metadata of the dataset that is generated by fluid.dataset~ when it receives data from fluid.bufflatten.
What I tried:
-
Global pointcolor - doesn’t work
-
pointcolor $1 grey grey grey 1. for each point - only works in some cases
-
colorscheme - has no effect
-
Using setpoint directly instead of dump from dataset - works but is slow with large amounts of data
The question: When I use fluidataset + dump to pass data to the plotter (as in my case with 200-300 analyzed slices), where are the point colors defined? Is there a parameter in the dataset metadata or in the dictionary structure that overrides pointcolor?
In your help examples, the advanced tab shows how to assign individual colors, but when working with audio analysis datasets, the points remain black.
Does anyone have experience modifying colors when using fluid.dataset~ for analysis? Is it possible to modify the classification of points to assign different colors?
Thanks a lot!