Hi there,
Here I come again. And using more and more flucoma, from our deep Max courses here to my own project, really this is really amazing and I’m so enthusiastic each time I dig new object I didn’t dig previously.
Sorry for such enthusiasm… Let’s go to the point.
A dataset. Very simple.
Timestamps, and one scalar value for each timestamp.
I’d like to give a try with all analysis possible provided by flucoma.
Self similarity matrix building would be my best bet here. I understand the thing but I’d need some help to build something (and possibly visualize it).
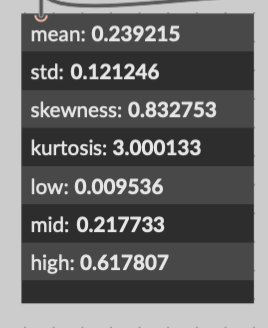
Ad cars I understand, we can compare a lot of things. Mfcc, novelty, kurtosis etc
Maybe building some different ssm could be nice.
The idea is very basic, find segments.
For the record, data are not audio at all (yet). This is a sonification project related to a glycemia huge dataset recorded. And already processed and available as a buffer etc.
Any help, ideas, and guidance would-be very appreciated.
1 Like
Now, that sounds like a noveltyslice idea, without the stft… maybe more experienced people with data, like @weefuzzy, will have clever ideas.
1 Like
Hi Pierre A, and thanks for the mention to someone else.
Beside of this SSM, which I’d really need, I’d basically also like to find data segments for which values are > or < to a threshold.
I used to do that non realtime easily for audio buffer, but for my dataset, I don’t really know how to do this. Target: get these segments start/end points for rapidly retrieving them. As I used to do with loudness for sounds, for instance
I’m still unclear on how your data is organised. If they are time series, why do datasets of single items?
if they are time series, and you want to segment in similarity, then you can run noveltyslice, which is a short-term similarity matrix. but it depends on your data. and how to describe it. we had the idea of having a non-fft version of this but it is in the long long long term horizon if ever.
in other words, I really don’t understand your data, its use case, so it is hard to talk just algo… if you could shed a little clarity, I might have ideas. or at least we can try to send you to the right tools.
Hi Pierre, sorry for my lo-fi explanation.
My dataset is a time series
timestamp ; value;
etc
csv.
I dealt easily (python) with resampling spline-like them so I have 1 value per approximately each minute of my time series
;
Then easily pushed into a buffer (v8 does it).
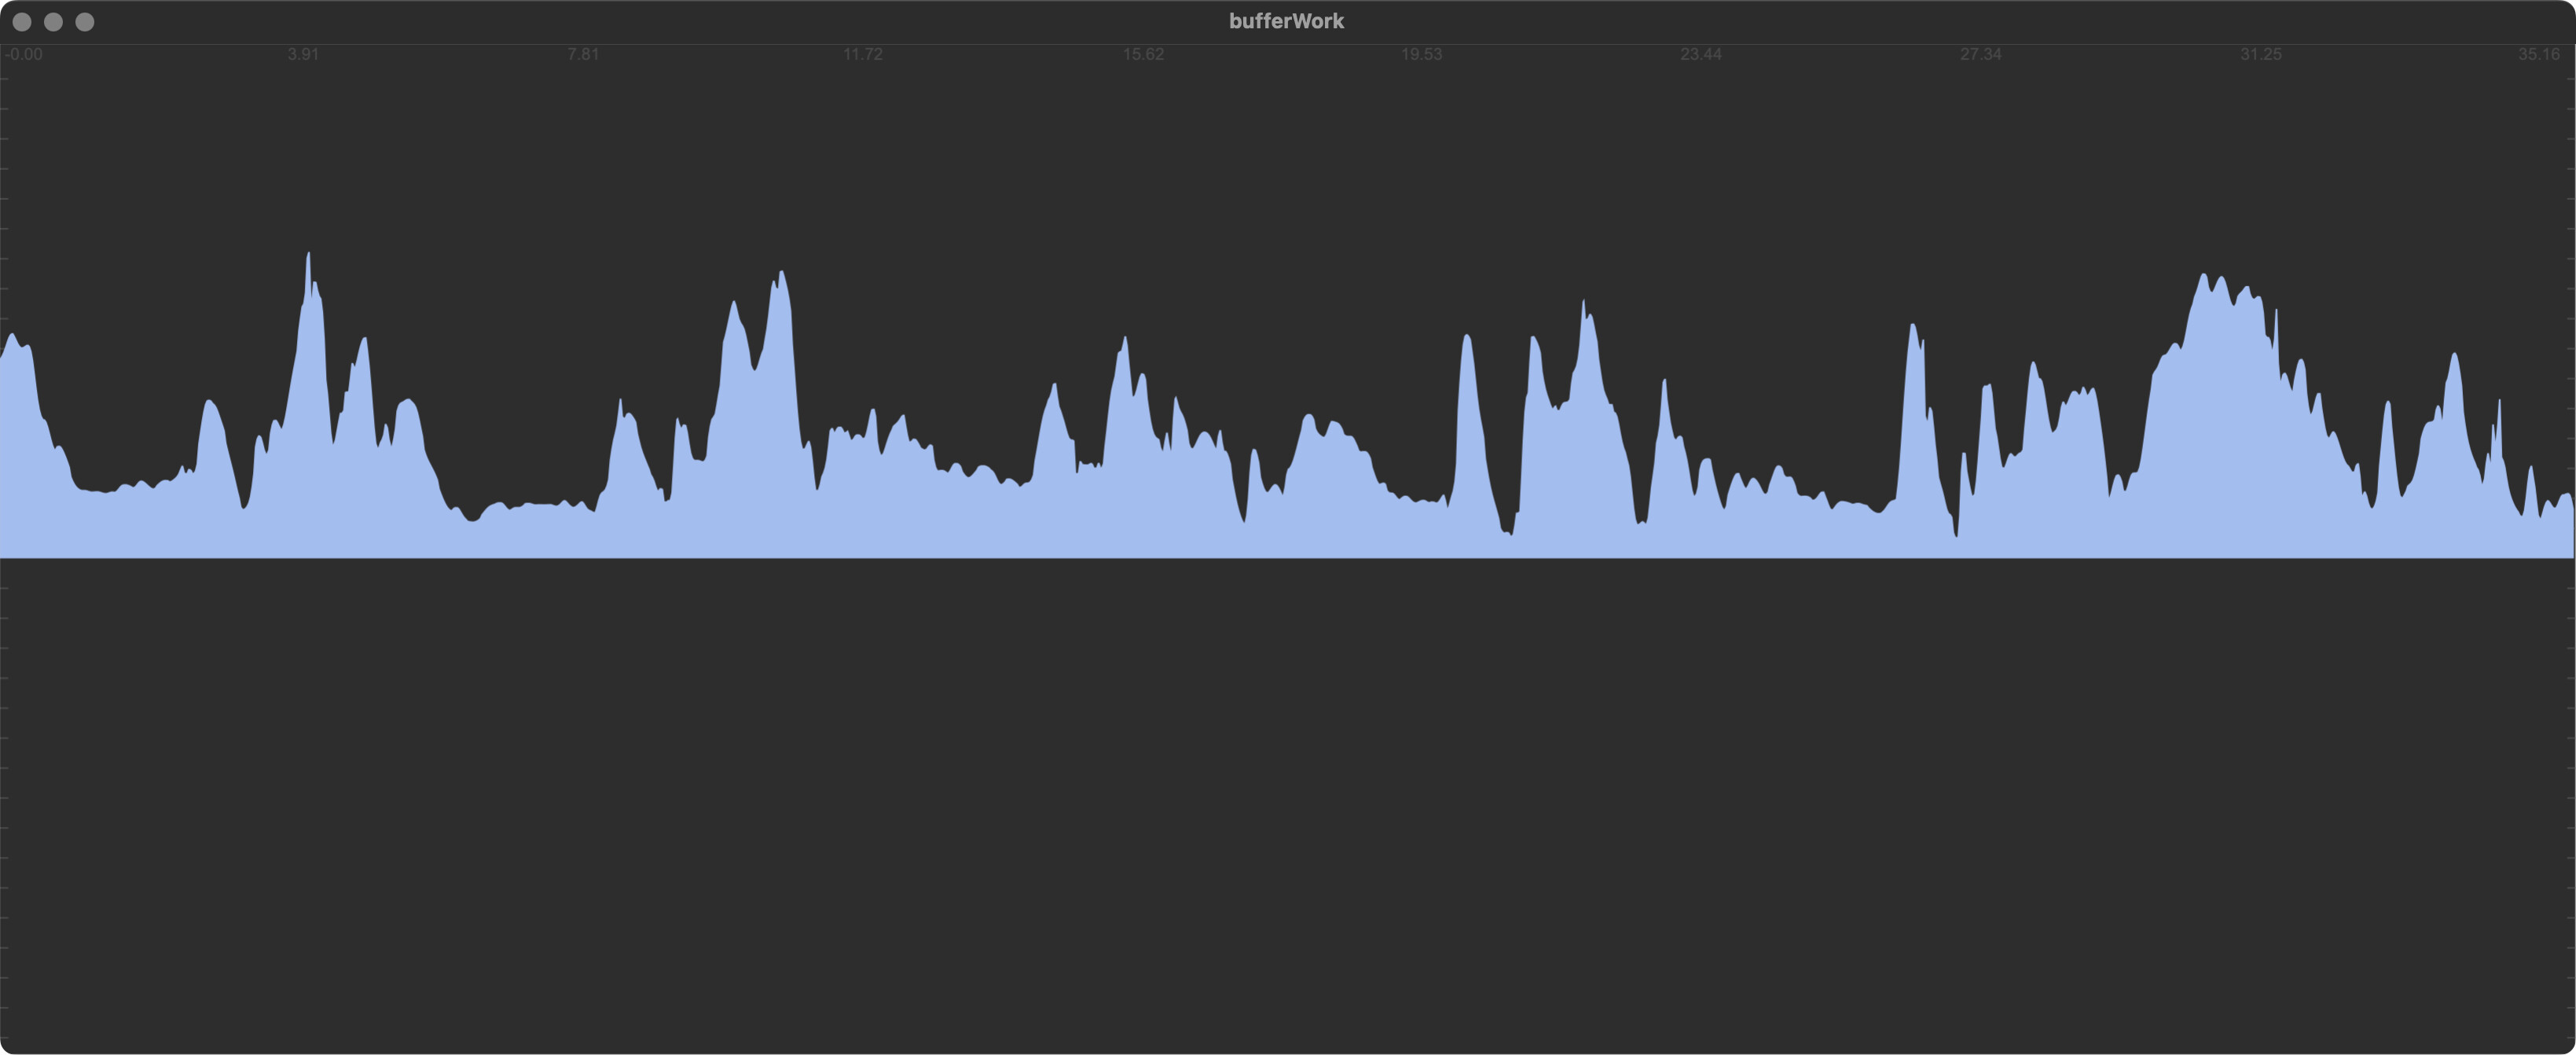
So I have a buffer, and this is the one I want to analyze.
My data are just a very low frequency curve, representing real measure of glycemia
they are moving from 70 to 200, slowly, only one peak per day etc.
I’d like to find fragments matching some criteras like:
- value > threshold
- similar parts (similar kurtosis, or similar raw values or…)
- parts where variability high, or low (stable parts)
Maybe, R would be better.
I could also do that using v8 but I’d prefer, if I don’t use flucoma, to do that in python directly maybe.
Here are my hopefully clearer explanations
still not clear. print the timeseries and show me the peaks. I might have an idea or two.
you’ve tried basic detrending right? ampslice with the filter to 0 for instance. or bufthresh.
288 samples (1 days of glycemia)
1728 samples (~5 days of glycemia)
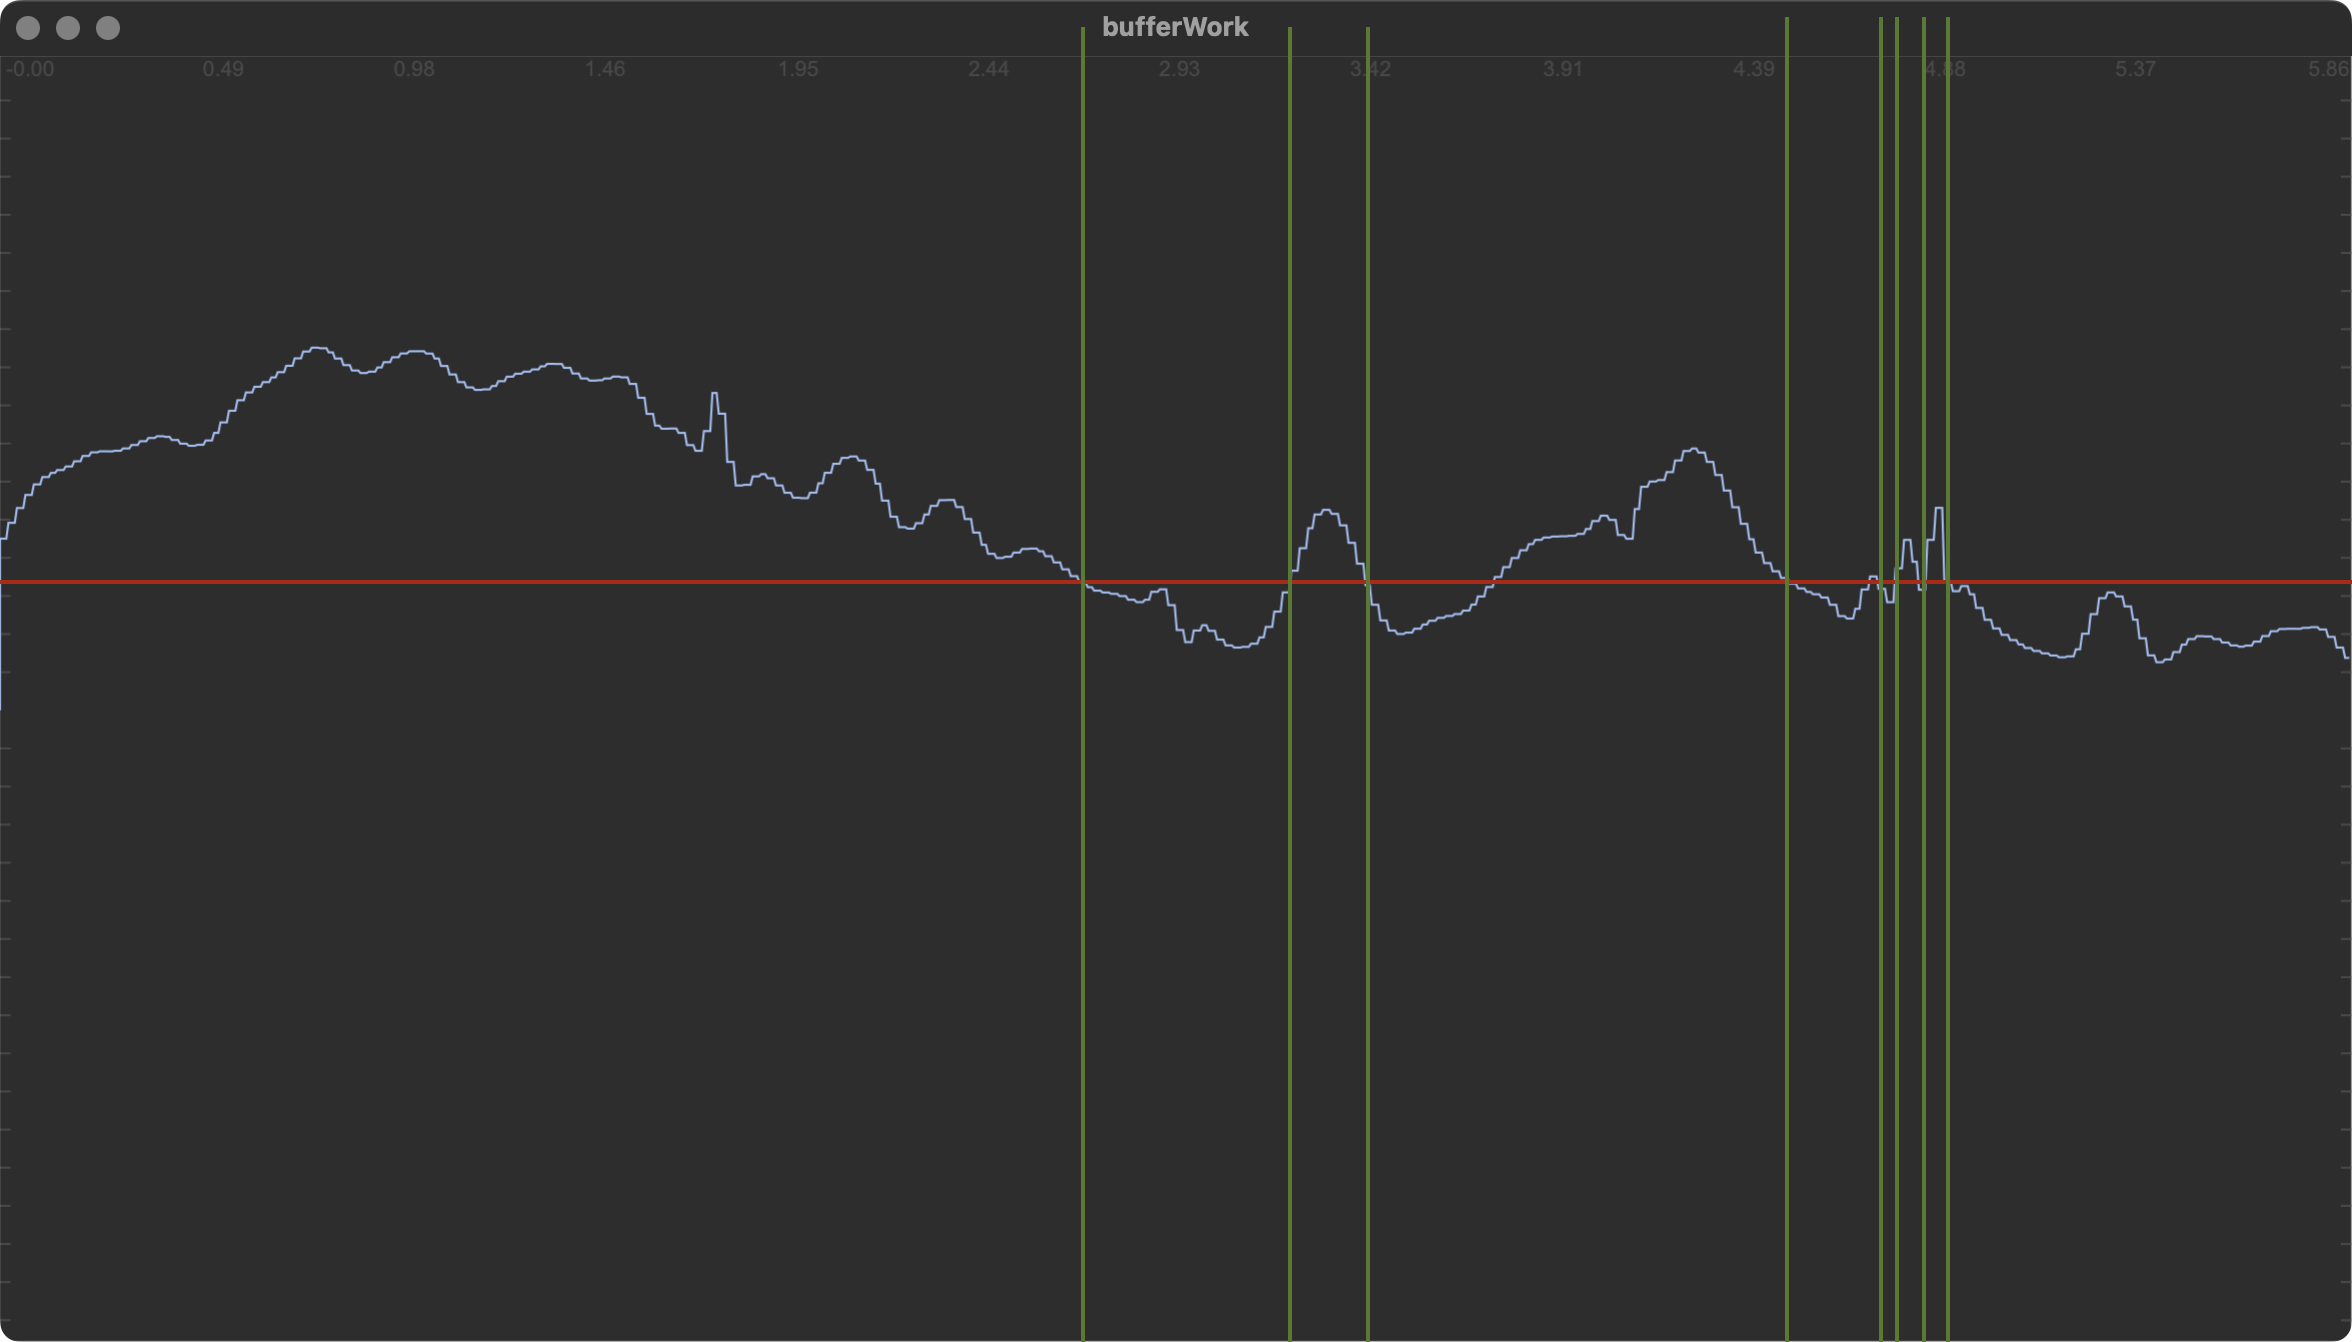
and can you draw what you would like to see ‘extracted’ (aka the slices??
If we talk about threshold as a criteria, I want all start/end points marked with green lines.
Maybe, I want minslice length in order to avoid too small segments as the ones on the right.
If I talk about derivative (1st order) as a criteria, maybe I want segments where the derivative is > or < to another threshold and get these segments start/end
I hope it’s clear now.
To me, I think you could do this with a pretty simple heuristic built in JS?
Onsets for moments you exceed or fall below the threshold seems to be the only criteria here with there being some assumption that you start above it (possibly and that bit might need to be defined more clearly).
The only thing that throws a spanner in this is the rising crossing after the third slice. Maybe you wanted one in there?
Hi James and thanks for your answer.
I just spotted all flucoma tools for analyzing audio here because I used them, for audio and wanted to use them for my data.
Yes, I think I’m about to script all of this with python because of v8 vs numpy, easy sliding window etc etc.