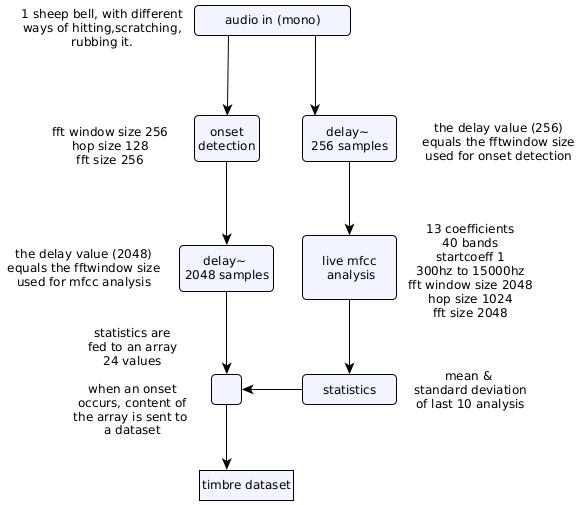
I would like to optimize for example the fft window size of the mfcc, to get less latency,
I’m wondering also about the use of mfcc coefficients, maybe some other descriptors would help me with lowering fft window, and help kdtree . I attached an example of 4 sounds that are 4 of my classes
When you say last 10 analyses, is it the last 10 onsets or the last 10 FFT frames. And if it is the latter do you mean the 10 FFT frames after the 256 sample delay to account for the onset?
The onset is usually quite noisy and therefore not always great at differentiating different sounds. It might be the case that you don’t need to delay the sound source by the analysis size of the onset detection because maybe you don’t want that in your analysis anyways. @rodrigo.constanzo has done a lot of testing on this…
If you’re really concerned with latency you can probably get away with a smaller window size for your mfccs analysis.
For getting really nuanced with these parameters like this, I’d recommend building a test harness of some kind so you can quickly adjust the parameters and assess the results.
I listened to the files, category 3 & 4 are very similar–the difference seems to be in the duration of the gesture. The analysis strategy you propose above doesn’t account for that, so you might think about if that really is two different classes or if there’s another way you might distinguish the two.
So indeed, this is something I’ve done a ton with.
A few comments/suggestions on your approach and then an example vid.
FIrstly, for the onset detection I highly suggest using a time-based onset detector (e.g. fluid.ampslice~) instead of a frequency-based one. Mainly because if you’re interested in classifying transients/onsets, the “slop” of where the transient falls in an fft-based approach can skew analysis (and add unneeded latency).
Beyond that, there’s loads of testing/fine tuning for the windows/fftsizes etc…
The examples I’ll show below use the following:
onset detection using ampslice with the following settings:
383 - fastrampdown
3 - fastrampup
2205 - slowrampdown
2205 - slowrampup
19 - onthreshold
8 - offthreshold
-70 - floor
1323 - minslicelength
2000 - highpassfreq
Then I use MFCCs in a similar way (delaying by window size etc…) but I use fftsettings of 256 64 512 and get 4 stats (min/mean/max/std) and a deriv for a total of 104dimensions.
Now the tricky thing, as @tedmoore has pointed out is that your 4th example is more a “gesture” than an onset, which changes things quite a bit. So either you do gesture analysis for all the hits, meaning considerable latency for everything or you do something a bit different to try and “filter out” the longer gestural sounds.
Here’s a quick screen capture showing what I mean:
And here is the patch and trained classifier: Archive.zip (220.7 KB)
thank you both for the enlightment! That was fast. @rodrigo.constanzo ,
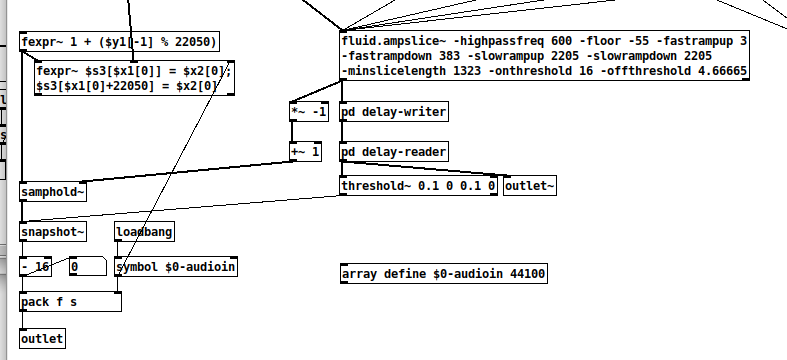
I gave a look at how you proceed inside “sp.mfcc~” , where you use the buffer version of “fluid.mfcc~” ( I guess this is in order to be able to retrieve more descriptors, and fine tuning other things ) and a buffer version of “fluid.ampslice”, there’s a bit inside it that I don’t get :
could you explain what the 2 “fexpr~” objects do (I’d like to try and write it without fexpr~ so I make sure I understand the whole “sp.onset” chain ? and the use of samphold~ ?
“pd delay-writer and reader” are inside an abstraction for any other reason that having a cleaner patch ?
Also I noticed the last update of “expr” family object broke the last sp-tools for pd.
with this error:
“expr_perform: bad result type 0
expr: symbol cannot be a left value ‘$s3[$x1[0]] = $x2[0] ; $s3[$x1[0]+22050] = $x2[0]’”
So the fluid.bufmfcc~ is in order to be able to point all parallel descriptor analyses (like in the right-hand part of the example patch) to the same exact sample/moment.
So the fexpr~ is something I’m fairly sure I grabbed from a @tremblap patch somewhere?
I’m not a super big pd user, so everything in the pd versions of the abstractions is just adapted from the corresponding Max patches and “translated” over.
The top fexpr~ is just a counter, where it’s going from 0 to 22050 over and over, and the second fexpr~ is working like poke~ in Max where it is writing the sample value coming in in it’s second inlet (from the biquad~) to the position dictated by the counter in the first inlet (from the previous fexpr~).
The pd delay-writer, I want to say there was some funky pd-ism where it had to be encapsulated to work properly?
re: the expr error, I have no idea, and wouldn’t even know how to fix it…
My pd install is still on 0.53.0, so I guess something is different in the most recent version?
@tremblap any idea on what could be going on with that error as I’m pretty sure this “poke” code is from you?
this is a newly introduced bug in “expr” objects, the author said. It should be fixed soon.
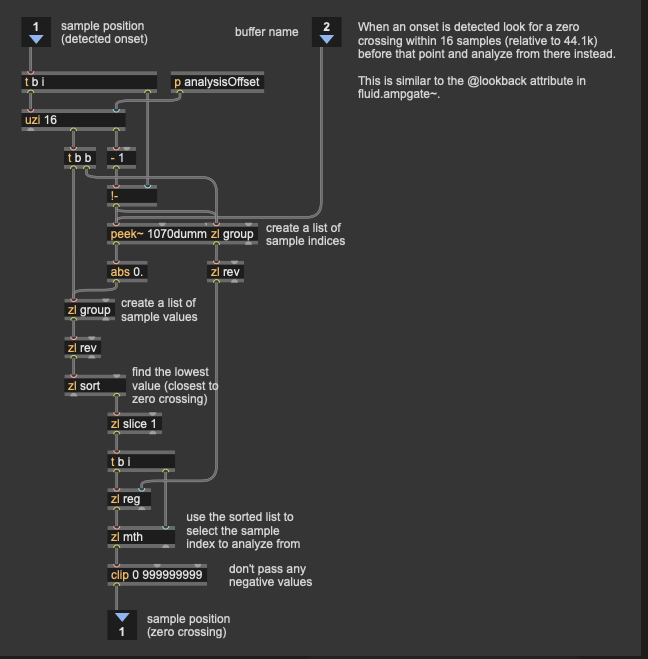
I made an abstraction (made an attempt…) reproducing the circular buffer in your patch, so I don’t have to wait, and I wanted to ask you about the “-16”, is this the number of samples it takes to detect an attack with your settings in "fluidampslice~ " ?
Ah that’s good to know. I was worried it was some deprecated syntax.
So the - 16 is a basically taking the detected onset position in the rolling buffer, but then starting the analysis 16 samples before that. Basically making sure you capture all of the transient in the analysis window.
In the Max version, this value is dynamic as I look for the nearest zero crossing before the onset is detected and use that, but I skip that in the pd version as it was too confusing to implement.
So in any case you can skip the - 16 altogether, but it has no impact on latency or anything. It’s just assuming that the “real” start of the transient is (up to) 16 samples before it is detected by the algorithm.