Did a bit more testing yesterday and got some interesting results. Still dealing with plumbing and concatenation stuff, but thought it may be useful to share some early results.
Firstly I realized that I was concatenating and displaying the pre-scaled/standardized datasets when plotting them.
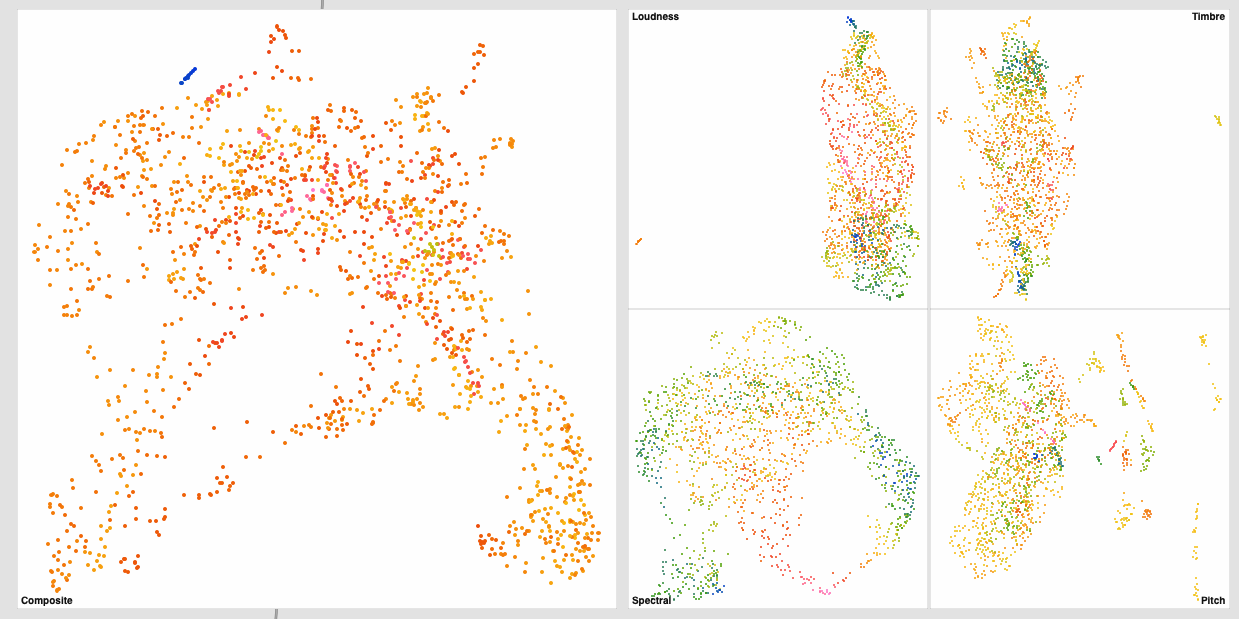
This is my initial (non-scaled/standardized) results:
And here’s the scaled/standardized results*:
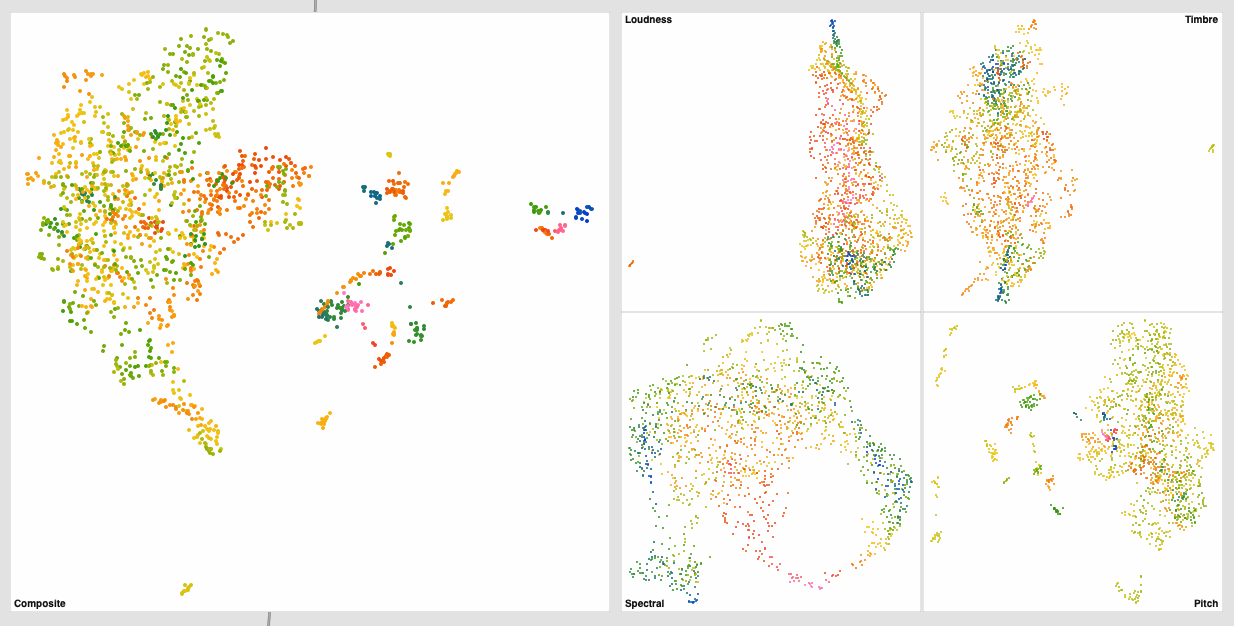
Not a huge difference (barring pitch) for the individual datasets, but the knock-on effect for the summed one is gigantic (obviously).
Both the spectral and MFCC spaces navigate quite well, though outliers seem to be more present in the MFCC (“Timbre”) one.
*I did revisit what I was doing for “pitch” here though, baed on this:
I basically rolled back to my older approach would only took a few descriptors, no derivs, loudness-weighted things and, seemingly importantly, scaled the pitch output to the same range as confidence before processing them down the line. My original thinking was that for the purposes of the sounds I was using, whether something was “pitchy” or not, was as important as “what pitch” it was. So I wanted confidence and pitch normalized before carrying on.
Even though the results look similar above (in terms of overall shape/spread), the sound is worlds better in the second one. There’s an appreciable order to things in a way that, for those corpus, overlaps a lot with timbre/spectral. This makes sense for percussion as the higher pitched bits of metal are also brighter.
//////////////////////////////////////////////////////////
Lastly I have a question about moving onto the regression step. I had a quick check on the learn.flucoma.org page for regression, as well as the help/reference files, but couldn’t find out what I was looking for.
I remember, after previous failed attempts, there being some “rule of thumb” stuff about amount of entries vs dimensions vs nodes etc… I know that "it depends"™ but, from memory, in order for it to regress at all there needs to be some relationship between these numbers.
So firstly, what is/where can I find that info, and secondly, that kind of info should be in the help/reference/learn somewhere for quick access. Like, if I want to use a regressor, I don’t want to have to watch 10h of Kahn academy videos before knowing what numbers I should put in the boxes.
As a point of reference I will have around 1k entries (for the regression idea). I presently have 800 test samples, but will probably aim to have a few thousand for more rigorous testing. I have around 260 dimensions in my initial “descriptor soup”, and PCA seems to give me around 90-95% coverage with around 110-150 of those dimensions. I can then obviously UMAP the output of PCA.
So I guess I want a small amount of intput/output nodes for the regressor (3? 5? 10?) and then an amount of @hidden nodes relative to the overall amount of points (dimensions x entries) being worked on?
I can obviously just test a bunch of random stuff, but from memory, there was a method/reason for choosing certain values here.