it’s ok, Ive done it in Max 
it is for peaks in nmf filters to resynthesise whilst I do music. fun. I will share
it’s ok, Ive done it in Max
it is for peaks in nmf filters to resynthesise whilst I do music. fun. I will share
Ok, so playing with this again after the geek out session.
First, it looks like fluid.bufscale~ doesn’t clip to the @inputlow @inputhigh attributes. Given when @tremblap said when explaining the patches and @weefuzzy’s annotations in the ex11 help file ("We take the first channel of our loudness data, and rescale it from (nominally) -70dB to 0dB into the range 0-1 (thus gating anything <-70dB). ") I expected the output to work ala zmap to clamp everything beyond that.
So I’ve tried doing the “second” approach where I do the confidence weighting, and then do a parallel loudness weighting to then derive the loudest point at which the confidence was also high.
With this particular file (same as in my last couple posts), the confidence and loudness look as follows:
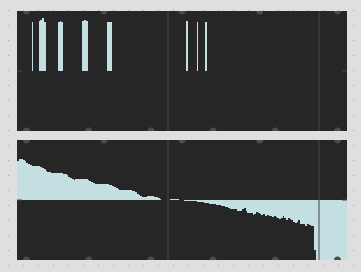
You can see the negative loudness scaling if I go -70dB to 0dB, but more so, this would pick the first moment in which the confidence was above a certain point. For this particular file that isn’t the fundamental (which happens halfway through the file), but it is perhaps a loud partial.
I went back into the patch thinking that I would just fluid.bufstats~ this stuff together… but I obviously can’t do that.
I guess for this approach I need to multiply these buffer~s together and then fluid.bufstats~ the maximum of that? I could brute-force peek~ it all out and multiply each value and then finish the peak picking in zl-land, but I wanted to see if there was another way to do this last step. (I guess there’s also jit.op-ing it, but that’s not great for real-time)
//////////////////////////////////////////////////////////////////////////////////////////////////
Another more interesting approach, which is what I was trying to get at in my initial exploratory posts, was suggested by @a.harker. To accumulate the spectra over the course of the file (or perhaps even better, of the frames which have a confidence above a certain threshold) and then to run an analysis on that, to hopefully pull a more accurate fundamental out of the partial soup.
So for this I guess I want to make a histogram of the frequencies kind of like @weefuzzy posted a few posts back. I’ve crudely adapted that patch to also incorporate confidence so that only pitches above a certain confidence carry carry forward, and then filtered out the empty entries and that gives me the list of frequencies in that specific file.
What I’m not sure about is where to go from here as I get pitches that are pretty near each other (e.g. 101.433144 101.632294 103.164848) as well as not really knowing where to begin as far as running the output of this into a pitch detection algorithm of some sort…
Also, I’m sure if there’s a better way to go about this accumulation/histogram step so all ears there too.
----------begin_max5_patcher----------
1490.3oc0Ys0aihCE94zeEHz9zprH7c68o9+X0pJBwIwyP.D3zocGMyu88Xa
HCoMsgIwcztQsfwW3b9N23yvWuaQ5plmz8oI+YxekrXwWuawBeWtNVLb8hz8
EOUVUz6mVZs9KMq9T5xvPV8SVe2+SUhwp6RPiiTeXuotRa8qB+iNaNXeYusE
1xcl5sOzoKsAcQQxxWlvPL2IpvcDiyxS96gkDtK1ma0g4mltD9+3vl0dkBTz
+fpRc88s6tycX4sgx9xhJcBKOKgmCGf+PYmEv7yBXzEALO2cBgxmAhOKZkWC
ZW4UHc2HTdzn+xildyJSkw97TMuYyld8fJ60w7IpXUS4m0qW2UrsurqopxMs
7gwJqLke1tqq4v1cS6WWWrpRu60KHLviudfUa22rVeROMcqAkeROm3KPm0Wj
eIeAOG6cBnPzGgNAo0E68ZPZWQ85c5p1G1Y5sMYfUEteou1ufyuF+xdceewV
8qBCEpLDOQhyHJNgiSjjLEkSIzDIMiwYx7gVBhRlfxQYTBAQo9lbBFqbMIvM
gJotIHyDbXLguoBCmTYTtj3avwbNl4CJ4XEBFEgyvTtPJ8MgYgnYvcDxVQbo
TRSH9lDFHRBFkIY4REBZhyDTJlSR.0IivDJAzKQj4tYJdBClKkJXHnEKiIxE
zQrWYp0kMGp8F.57qw7Nob3PxFUENkG75WQNGJhUXf5n8Mc13TEEmKBPi6Og
tgxnDdbA4FSk6wE4YwEozPYza4AFDVDQ5mL1r9VCTAa9UltLLI7H3PwQDlqN
rYit66IsFPky9h1rcGfkn.YVnJb3DBotLj2T03pACZUQ81yhcDMhXeS0Ay5L
vB.OcS2u66I222bnqTGLFI2uV2aM0EVSS8o1mj6CqnoZMjGHg0YK5fwKpeCV
Tm21QtX3BJ2ULkJTRf0hjpvTkiT0LRR7VvkSLomOTR9+iPIj.4yaDgDmHELI
hb4hl1j6g++8nVXjf8EFQX4kgLnDOruv1Yd5M837Hi4a0o+N4.jfOGHcjIXf
Eff9Ys.yvdvhI6NPcZAMpn2l7ankIgKSiCkmPz.1wZSM4mP3RGDW4lNvwLEX
q1VXscI8E6a6iaYPHsmOE0RnLnbtOC8sb8X1GUwuHQYPDx7ck6oSAOAJDxhQ
AP7U8zzUGr1l5eBLd4vZhGoX53wK7bsyhER5QwzAaxC3n9PXmn98LFwr7Nca
UQoNN40Criv9ST40lGi9ucn7.UvvKEJNwtH0GASPOl+AQvh5hpm6M.guM5B6
Afy2H2vMar8fFCvrG1klhG05ch7LxzLdE0syAVrX8g9HX8MZphY.CP6ycJ7V
ct4.F1GI0mn5+Go7HEe.LdNY2i9I3eEMu3UI6UNW+mZaB4EChd3kztL4Gp2j
sLMcRxvjNq8e1RRNCIgyifjHr4foSA9wWjI5WfngMYlfdsnyuMQymgnG0uaS
R34HIdDjDZNwLjXDc5nebQIghgjHyJOHF9oYEPfifflSPOODyeaNoYJmaNXP
LCAwNe8iaKIFilSXXLBNvywoMZHtcIgtjjn+p7a3KW2O7T0h11G0c8Cq1KTf
awmZ7SWtzeooNbomo.ryB22tKLe+2gLsnCnHXA9A.2S+SvehG9vJotOkVW8A
yfrA3Bhr29b0KeR9wu3Evqg6H630b.baJNTYO0hTTVpqskMUAsx8kBktuTnj
nvHtqkHWIyA5nnIbRbrh7q4ASsCw5S+JiCGlthUamHCzvnCGxyXitwkCduNP
o7PyiiA.rGzdyXFyTu8I.1SF68f7IfkhILrxoCDAlQ8svBJCMn9QSsNYukmW
wtFq5FSU0Q.s338BtYCDFS21Ur1.58.e0A7iN5s4vOwxy1ZhnFVFdbYBoDrb
KOaqWurwUgU4HkOphLDU4ZAcgdwp.J8AiLV3.8PuscMsMciYmvRUGm+AayQf
NVSMjb9ltuSyNlmWLPFe1QWdeFEBqxw9V.lAc9ZirBEY76TwoT8sEgZY9Mzb
22t6eArL1p+C
-----------end_max5_patcher-----------
What I was suggesting was accumulating raw FFT magnitudes - after that you try to extract a pitch from the result. You seem to be suggesting accumulating frequencies which is a very different concept.
I see. Yeah, I misunderstood. It was fun building that thing though!
So would that be FFT->cartopol~->frameaccum~-type thing?
And on the contents of the buffer~ independently of any fluid.stuff~? So if I wanted to do some confidence weighting prior (or after?) this, I would do that as a separate step?
no, but stats does ignore anything under 0. that is what we said ![]()
As for accumulating magnitudes, there are no pitch detectors in our toolset yet that accepts spectrograms. But as I said yesterday, and the previous weeks, I think you should part the search earlier.
but if you want with the data you show, I presume the loud bits on the left are the right ones, so a search with a loudness column in the dataset and a condition on loudness and pitch could be something to explore too.
For the frames of interest - take FFT->magnitudes->weight->accumulate->pitch detection on the single frame representation.
I would think it would be more useful to have fluid.bufstats~ be generic and do anything with @weights.
In this case, the ones on the left are the wrong ones… It’s the area in the middle when the loudness is lowest that has the fundamental. But picking the loudest from the high confidence area would also be perceptually useful, just not ideal for finding the fundamental.
I’ll have a play with this, but I think this may start getting into territory where time/latency may become an issue.
That being said, for creating a corpus, having an “accurate as possible” algorithm at play would be ideal, even if the real-time equivalent isn’t as accurate. This ends up in apples-to-oranges territory, but I may not always be trying to match pitch via pitch. I could aim for pitches below/above a certain point, as being determined by some other descriptor or envelope follower or something.
And for this part specifically, I guess at this point, it would be the application of one of these algorithms from a first principles way? (as in, none of the algorithms, as they are presently exposed to me, take a “single frame” as an input)
My assumption is that you are working Non real-time - I’m not sure how you could possibly be using this approach in real-time so I don’t see how latency would apply.
You might need to use first principles yes for the pitch stuff - most likely peak picking plus some kind of heuristics on those to guess the fundamental.
My “real-time” stuff is actually JIT, so it’s an offline process anyways.
I just meant that I’m not gonna get any good spectral resolution (with regards to fundamentals) with 256 samples, and if I chubbed that up to get better resolution, then the latency issue comes into effect.
I don’t really follow- I thought you were analysing a corpus offline - no? If you are on a corpus I don’t see how the latency comes into it. If you are in JIT real-time then you need to explain how long is “JIT” and why you’re looking over longer periods of time at all (which of course means latency).
The process is the same (corpus and JIT), just slightly different analyses and windows in some cases.
For the descriptors/loudness stuff I tend to keep all the analysis parameters the same, so it matches like-for-like. Some analyses are inherently offline (duration, time centroid, etc…) so no JIT equivalents of them as such.
My real-time JIT is the 256 samples immediately following a detected onset, which then goes through all the fluid.buf-based analysis/stats etc… So my latency is a bit longer than that, since the analysis process and data manipulation takes a bit of time. Definitely don’t have 4096+ amount of time to wait for the JIT version though, though I’m working on a thing to hopefully be able to predict a slightly larger analysis window (4410) based on the first 256 sample chunk, and then I would have enough time to work with for some better pitch/fundamental analysis.