(weighted) pitch analysis

So I’m loving the 10b example! This is exactly the kind of thing that @weefuzzy helped me with ages ago that would take some kind of centile, then a mean of that, etc… The new approach works worlds better though.

I’ve gone and made a reduced version of the patch to test this with a bunch of sounds that I think are problematic.

First, a couple of questions/thoughts.

/////////////////////////////////////////////////////////////////////////////////////////////////////////////

Is the idea with this ‘newschool’ approach of removing entries via fluid.bufthresh~ that when you have a descriptor space, you literally ignore queries that check for pitch if there is no valid entry?

I’ll rephrase that as an example. Say I have a corpus of sounds, and 10% of them have no valid pitch data (via getting zeroed out by fluid.bufthresh~ when creating a fluid.dataset~). I am now feeding it live audio and want to query based on loudness, timbre, and pitch. Will all the ones with no pitch data get completely ignored?

Similar question for the input side. Say my input frame has no valid pitch data, but everything in my corpus does. Will that return no data?

(Obviously code is code, and one can make these decisions, I’m just generally asking about the paradigm/intention of having intentionally malformed entries)

/////////////////////////////////////////////////////////////////////////////////////////////////////////////

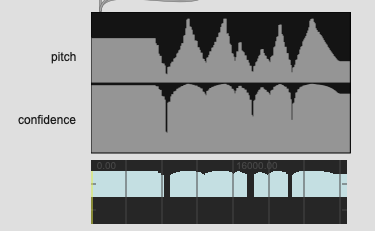
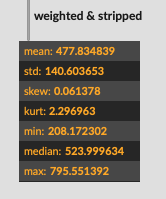
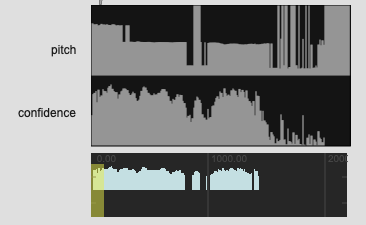
The reason I’m asking is because with some of my examples (code and audio below), there isn’t great pitch data, but sometimes there still is pitch data. So I was thinking of taking stats for the confidence and finding the max of that, and then adjusting threshold based on that (and perhaps std). So basically trying to get the “best” pitch information out of that frame.

Where I can see this being problematic is the “best pitch” for that segment may actually be shit as compared to another entry in a dataset which may have the same final number(s).

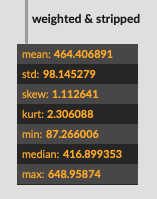
Perhaps a solution to this would be having a summary confidence statistic. A straight mean would be shit for lots of reasons, but perhaps something like what % of the length is above the given threshold. If it’s 5% (or 0.05) then I know that even though I have the most representative pitch from that sample, I have a low confidence that it is in fact that pitch.

This confidence-confidence (would that be a derivative of confidence, or is that specifically limited to change-over-time) would be a metadata-esque value that can be used in the query but not in an LPT descriptor space.

/////////////////////////////////////////////////////////////////////////////////////////////////////////////

This one is a more technical question.
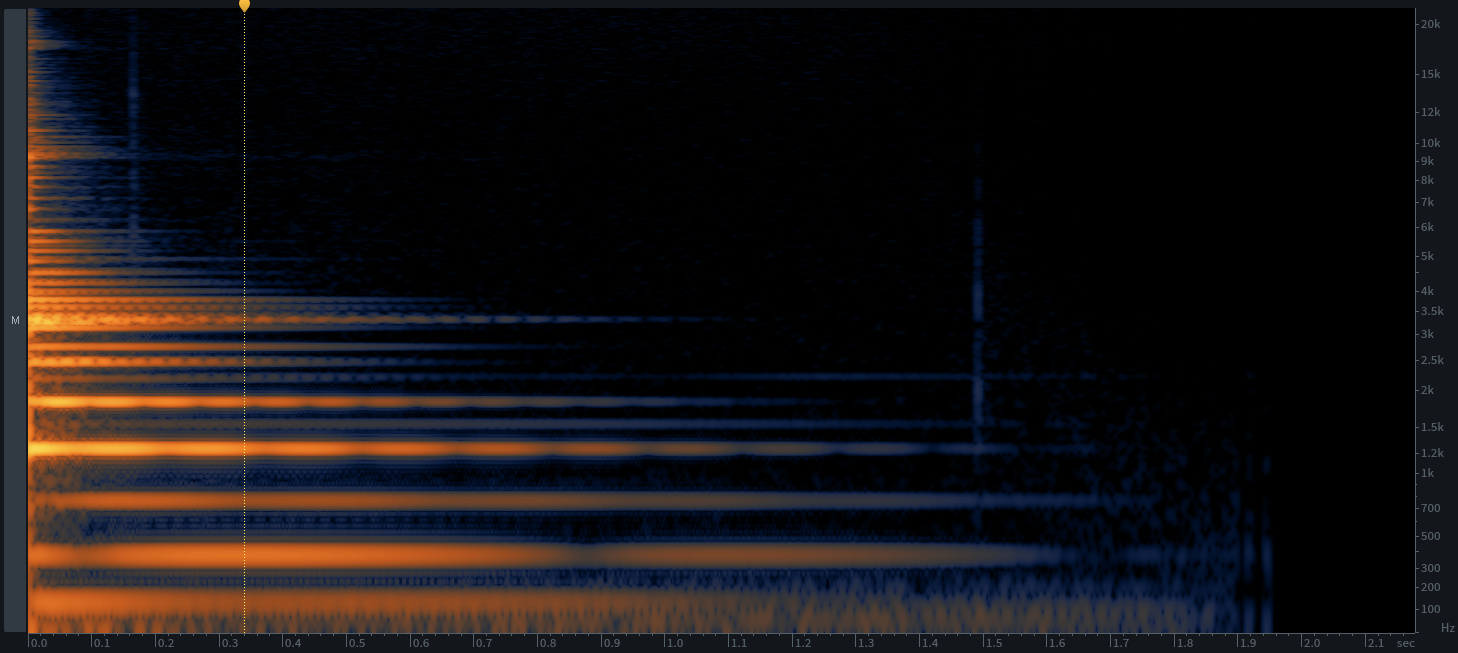
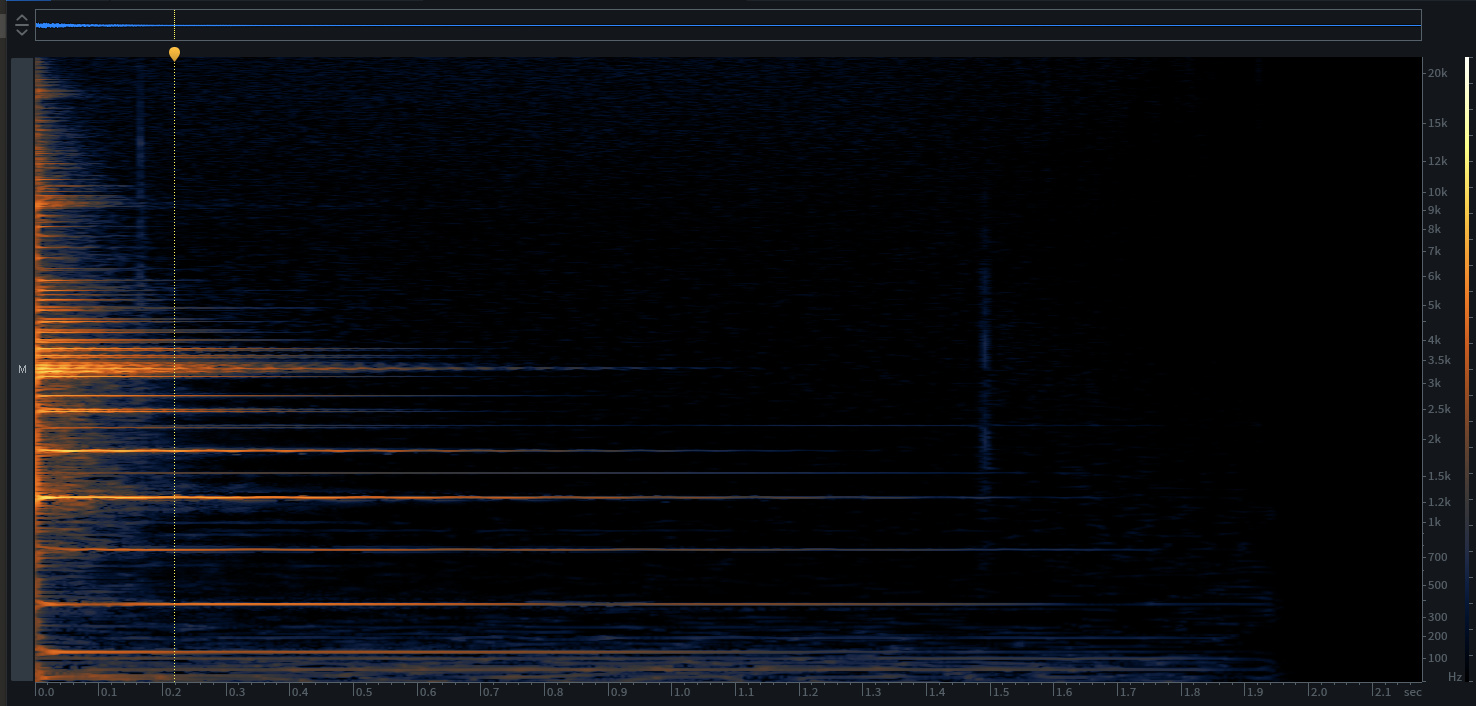
Harmonics…

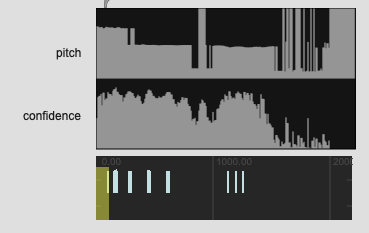
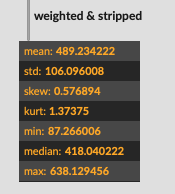
I’ve gotten mixed results with this so far, so I’m thinking it might be an even/odd harmonic thing as some of the metal sounds I’m testing with have funky harmonic structures.

I guess this comes down to the underlying algorithm, but when averaged over time, or more specifically, when taking confidence as a weighting factor, it may decide that what it hears as a harmonic is more confidently heard than a fundamental. So almost the opposite problem that could arise if doing loudness-weighted pitch analysis.

A similar thing would potentially be the case if there are multiple pitches (or a gliss?) within the analysis window. The confidence may be high for many of those pitches, and a mean may produce a…well, mean value which may not actually be in the set of pitches.

For all my tested in my example I’m using median to hopefully mitigate against that, but the problem still stands.

So is there a way to perhaps balance loudness and confidence to get at the fundamental?

Or perhaps does the YIN (or other?) algorithms spit out a list of harmonic peaks, and then that could be weighed in together with the harmonics.

/////////////////////////////////////////////////////////////////////////////////////////////////////////////

Ok, enough chat. Here’s the code example:


----------begin_max5_patcher----------
2165.3oc4asraiaCEccxWAgPQWT3Jv2TLqxxtn+ACJFnHS6nLxRFRx4wLn4a
ujTOhcr7XJYJiAnAH1NzR5xy4d48EY9ws2D7Pwqpp.vcfu.t4leb6M2XGxLv
Ms+8MAaheMIKtxdYAIEa1nxqCVz7c0pWqsiSBAayheCjVCdHN4ace+ph7573
MJ607WprmU0oIw6+sqhSreKpcr7caRyyT0U6O3135jGSyW+0RURcyzkIiBgK
.LJ07FhBMug4gPv+r2SuJ861mN1708BnXWcmD5FMcocJV7vS+IGEXF6eu8Vy
KKtPhAGpIj70f5BPbdb1a54yryMRogLn1WwPl+XFnOYFTHH4wcIeCrJMSUAR
yAOpJuBrClgLLBGS7M+vjSgedI9Y0phxMu2AtG1sZkprG7aS0PH7EU55G0Rd
HvxNMXivxvHBgPITo8GFaAfDwBERIRRoPBQxkRtlAXbKsP2iHNDw71QaFp9s
spFYDrJqHVqe+oeHKsx9dP+CeehiMEhKW8h9lOxtRKwkaTUUfm+dQwFfV+Ag
H.JLXrqhHhPDmyYbFz9CUScHINDhDPbjPFQfHJinGjgs1P3SRcnSQcCSGdcc
VikiZI32AU0koa2pVN3hr+NttvGquDTKswgc+Hz9hzK1jTMmg3PFTxnRpl1P
BKsgNIsMvZLDSLExYYZRc3yopWFqU.25kfxjgFsOF0DsYTSYAdecRRQVQYyy
19vfgBnLBRjXDiGwwByPHIGJhnDDQf0j0BfUf9aMhkN1pCTC1nhyuSaXrT+x
2TubG3a6JquCnIG8KpkoluU+DuaPdSbNdSipP5m06XgXpKWLy6zh73x2Fbgi
f3Q+H6xepPGTRLMKFhNwjHAQJIZGGXJGa7dPvvyf7nS5nXwO42A4B5kyEOG+
QXnUY6RWFpiMgMtx+B4eNhvN7J.22DGCzD+ppNttJryWT3m8DMNxEKEg3iBf
IHd0KLmOEBrtX85LUvn8YBONLMKBFhQhH8nRpDRoLsuArMeWLc7fLUGaXHbR
kA8SrRs1tVU9UUd7CY1aD5uETqiqUuOHyfGIyzl6FGNUEdU5Zcx3CSGSJ9h5
6KiS7D3DHSrFJqIvyXhzP4dz+2e7tIPzngTDZHKY7wVxzYQ64yLISdKIaBVr
Cx.5vAGy.j4fAnWO6WVjsFSNWFJvZjo8XoSWQHnhIZ+Rtdtbam6Lgrygpmcq
huRtUM8c48llKTkVAtOqnXK.MQ5n0yJhbtJZvmwzTmVhouGCSMyR8MyZQMTh
s53AqblEMkxX3W0xXnHq2VJL534+zppgK+eXUMszHgQGJ+yYqrF3u.k0zAcs
Chi6cjjc8pqAMq00ftn5ZlHoNb8LXgWqmgH8nUTOmXw+6f6qJ1UlnZHE8eYF
cPFBbeamLAmuulmuNPHNDQkLo.CQbYDUFo8wQOWrKxo3MaDq86Z4vDIdNHx5
GKUUOdDStTUUmlGabObHiAtu4NJxVpcsFY47R82GmO9f+MrIR6UioycSFwgP
MWhMtnom0q1kxlQ+JXV12PhSXeBt2.uTUYUxt5hUqzgtXSzlkNPxxLIZdYYt
vmobkTjuJcoJOY7M5fgGX+HzIWcj6OdicGbTcZU5STZM.FM.0YHdD.Msl5H.
RnS.fSZwhY2PhWqNBfUp58ikM1p+FbukFbCRhn9MR1jJx+opcoiUaNHDwDwP
aelLTeg5baa20iH4OOk5NoZ18yiSFwjie3S8gEcjWD9tjyG1UWWjOMGcL3kU
X8IKejPtRUV2qMrKO9HZxG0ZuREWuSGEFLIeEsgcgMd53x4MD.1mtNJUayzk
RC9sQ2fPRSe+DZ2ellcx7pmgI4dbYYwVypvwp9ZQBmaQhzZnyPiuiImNn8Ln
wFq5By46ARZjecj6wT+ZhjsWivPZmviUk1hVcRYMa2KYpcAqeo3I8hMoxXiq
qKGeTLFFexpkPLWaCuQ1My9CxDdbgnPWQX2t9r0+5D.ZeAViDi3Yvr1q6hZj
r0yE73Skg11X9L5wxYiZlXiDZoBVjcS2PH4LB9nqjcwTMGz0hX3.FaF4.5bw
ASUwSIFPKlQLiN.y1qHHKM+yG7V6bzL9gDQSNmsBqsgIK.eLM2qAQ6eQ3lKZ
Px1UIgvtHoHOHoqlfDT8CgcFIQoGLcJJWpJOcoEtJZFzEPJ7.H4BWjDaN.oo
1ryJZeXaRbwj4SDQOFQyO8x4ygn0oO4NpuHI4hSFjuVPdNAIH9RRHWjDxGRB
6hjv9PRDWjDwGRh5hjnWCWzVIw78xKqn4tHZ9kBRW7SJ7giRgKtLDPeIIjKR
B4CIgcQRXeHIhKRh3CIQcQRTeHIlKRh4CIwcQRW75IWRtxbjUt7jq3trdh5C
I4ff7QNwToCBh5ijJntj4DcVxbxcQi7cNwTlq76k5Wj5RxTcSmKSRtj9M0GQ
UntrxlRlEaFmEs2sYHtrlT3iDvIrqUYoNUx1m.tunyIUMSSqZh2t8YUYU6Ea
EQvl3mZNti1y0Vvlz7l+z1uofR0yocWu8eZxf3xjGSqUIlMKz1WnW4zflasP
Cv7cosVqZvoEYU8aYet8P86Q7l3W4l1kYAiFKqh2kUeH96OQleMM2L2aoBXy
Iyr6k82ppGV+4Sv4Gu.C+HYg3jDU99m1SXXj4JhLmzSd+49jdvY6bQqtpTeq
VnYwQK.1nm8ocZ380sG.XaK89YP9foDESXXoY1zcRSggXAkg78z5fMaye5hU
oYY8.5l9mk9g012wf0kwKS+3PqzheTuNw7Ofo8L2d7m1STs2Ft61DQQZlawf
e53aq6tvRHRZ08jVcu4S5gPe5thyW2PxXQ++U0ZEPYw1hxtEi5aU1e86pK5A
ZmOflEmmT8c3pC2zhM8z0YqKqNipMqfX6mrmy4IaY03jw1qayjpZa6IT21R7
a+2a+OLaTE4G
-----------end_max5_patcher-----------

And here are a handful of files that I’ve picked that show off different problems I’ve talked about.

examples.zip (856.3 KB)

My pleasure.

I don’t know… We are now doing research. You and me included. What we care about, when, is what we are trying to empower creative coders with. @weefuzzy and @groma made us amazing tools to try all of that, but since ‘It depends™’ all the time, now you can decide how much depends on you :slight_smile:

Now, this is fun. Maybe you care about this more than your think (so sieve first with nearest pitch a subset). Or maybe it is just one of many (keep it in the kdtree)

This is what I was saying in the other thread. This is where your judgement and the flexibility of the tools allow you to customise the interaction and the search. There arre, sadly, no machine remotely doing situated Rod listening…

I’ll read more tomorrow, this is my bed time, but this is the overview answer. Keep on digging. Once you find something that works for you I’m sure it won’t work for anyone else, but the process will teach many a lot on how to bend machine listening and learning to one’s musical obsessions… which is the whole agenda of FluCoMa.

More tomorrow, with the code. Now, dodo.

1 Like

So I’ve returned to this and tried doing the trick that @tremblap suggested by setting a different @low value for the stats, and while this works in some circumstances, it’s kind of random.

I think what’s kind of missing here, or what would be useful is to be able to calculate the mode of the remaining pitches, or a threshold around the mode.

At the moment, by brute force, whatever the mode is gets weighted more heavily in the mean and median, so that kind of happens, but it’s more a tangential relationship.

Take a file like this:
sine_high.wav.zip (2.4 MB)

It’s a sinewave that sits at a frequency for a while, then sweeps around a bit.

This gives me an analysis that looks like this:
Screenshot 2020-10-03 at 6.26.27 pm

Screenshot 2020-10-03 at 6.50.31 pm

In this circumstance, none of the available stats are correct (550Hz is correct). I can’t change around the centile values to get the correct value either. So for a circumstance like this, the mode would give me the correct value (or closer to it).

The median, in this circumstance, is closer, but I think that’s random chance as that happens to be closer to the point where I was oscillating above and below, and not with the fact that that pitch was the mode of this set.

So this is a kind of synthetic use case, where you have a segment that has high confidence across multiple analyzed pitches.

Here’s one of the examples I uploaded above, which has a different problem.

METAL RESONANCE HITS Soft attack PIPE 11 - 1751.wav.zip (61.6 KB)

This one looks like this:
Screenshot 2020-10-03 at 6.28.30 pm

Contrary to @tremblap assumption/suggestion, in this case the fundamental only comes becomes the louder point later on (the lowish notes halfway through).

What’s strange here though is that the lowest centile is much lower than the pitch:
Screenshot 2020-10-03 at 6.56.33 pm

I’ve not manually peek~'d through each entry to see, but I don’t know where that 87Hz is happening in this segment given the thresholding.

In this case the fundamental is 125Hz (ish) and the loudest/first harmonic is 387Hz (ish).

Because of the threshold (the default 0.8 from @tremblap’s patch), there isn’t a big pitch representation in the trimmed version. If I manually lower it to 0.5 I get this:
Screenshot 2020-10-03 at 6.59.19 pm

Better visual representation I think, but still equally wrong stats:
Screenshot 2020-10-03 at 6.59.17 pm

In a circumstance like this, some kind of auto-threshold might be useful where it takes the max confidence, the std of confidence, and guesstimates a threshold for that particular file/segment.

In this particular case, setting the @low centile to 20 does give me a closer (though not perfect) pitch if 396Hz, but that feels kind of accidental here.

So in a use case like this, having some combination of weightings that looks at confidence, perhaps mode (though I don’t think that would help with this example), and then maybe some kind of chroma weighting where if multiple pitches are detected that correspond to a harmonic series, you select the lowest (or predicted lowest) of that specific harmonic series. That wouldn’t work for inharmonic timbres of course, but one edge-case at a time…

/////////////////////////////////////////////////////////////////////////////////////////////////////////////////

SO

Confidence-weighting is definitely useful, and significantly better than vanilla mean/median values. There are many (including most of my) use cases where mean/median/min values will rarely be correct. I have a feeling that for vanilla confidence weighing a mode of the remaining values may be more accurate (generally speaking) than mean/median, although they would be fairly related.

I don’t know if it’s possible to compute a mode of a buffer~, or a range around a mode without dumping everything out into zl-land and then back.

And for acoustic/harmonic sources, being able to further filter the pitches that make it past confidence weighting by either range (lowest pitch, but perhaps throwing away the lowest centiles) or more ideally having some way to parse harmonics/fundamentals mathematically.

I’m assuming you’re using ‘correct’, ‘wrong’ etc as shorthand for '(not) what Rod hears ’ rather than ‘this algorithm is demonstrably incorrect’?

Can you explain why 550Hz is the right answer here? Maybe we can find a way of getting closer

If I look at the lower end of this file in sonic visualizer, there are plenty of prominent peaks below 125 Hz, incl. a bit ~87Hz. Pitch estimators aren’t ears, by any stretch of the imagination (and how people resolve a sensation of pitch from inharmonic sounds is only sketchily understood in any case), so you might need to give it more to go on (e.g. constrain the pitch detection range)

There’s jit.hist but I don’t know how you’d deal with weighting.


----------begin_max5_patcher----------
1678.3ocyY0zaiaCD8bxuhABKP1s0QUj56dJnm18du0sHf1l1gYkDUEoRhyh
s+16PJ4DkM1VJwRF0GDfIozv2adyvgje+7yblKefqbfeG9K3ry994mclsISC
m09+ybxYOrHiorCyYgLOmWncl0zml+f11tXErQVCKtgUrlC5a3PQc9bdEHWA
yEEpYltuHCJ37kfVBrk2VqzlApvgKka+fYhB9BYcg8qRaarrBGUgloExhq28
HX5E2HJVecEegtAOQ9ItdyffjP2Tum+4SRlAzzPSe99tdve29Iv4qrVmw0Vf
501pXoEdx42dYRryyCUTrcjDSa+37yMOlcjr3mk2yuiWMqgKk0YKAVYYkjs3
FjpDJPT.KEqVwqv2FtmsQAez1tkLyYeiq.0BFRQqANSsAXVJF3EK+jK70huV
7kBnjUoEKpyXs1A6DpKg6E5a.z3a.ENBzqfeWsbcEKGcdbUow1luUcYI5Vq3
3bhqbg+fufUii9Vg109FfRjWlsADqKjneCPR0HBprBikLMqEcLblTImylii0
Lya.3EOJk4W.+SsPyMPPjsYmRi3dkFwGPZ3039IAtAgczFAgFoA0zGwy6MoM
hlbsweZnmExBckLSY8DXbUgwS+qsjKxxllexu4BeongUWvT7Yv2Jj2aFu9FT
VLudUo.YF.6VhdTjAwtZ8wTuKodeq4yNC9xE4fhqsCfYrJpUVhhEzdDuO+H7
QpG2GtDeqOA+B34RlAqE2gt9ZEPRSSrI.1oWLnWeDMH1kzwE4Q8M9Hhoun2l
KJb5CeebFjKWxxLH1Y+XKLzN+iS8sRsPOKReanwezPSSh5CLcCP5lF1Ne6lJ
M.8zsSd5dm7aSQ2zjdSIu4q53LCbliJLmmdwt3i77DBkxbMu5ZdAlrf2kPNd
ryuGs1qbj7GJqfOHHnbl3MDlIL1MJ7mVjINpGlgrWlYWLRb5n4wy4JEaM+Uv
9CjgfUDQ9cCHSiLQjtgiIVS1IVoimG9wLvmFEGAJYkFt7f.mXyDEkD4l1wGS
iwLQMIhdup+cicxng82keNLtI4JIBc2cfKMdzcyQoSsaVCYPV+91vfP2vNfk
jPG.Xe691nwqDx8.36ZRcsh.+F9jBWYJGjUgqJwggHxwUlh5FbiL.IlNpIxh
B9eTvcqZOLw6E6Rf5ENIA2Q9iWvcclVnxDKO3Z2T+.aoFzXKVHME2ZZ73vjR
7nsCS8cuFlAQCY0arlRjCPP0XAagDjNSLrekdSy6Pl33Fy1WTkhrL3pLr94L
dwZrBWC5FP1ChmKsi3gDl1xwir5Iv24DPC4rR3JyCpGXgE3MPhfll75h0I8V
GzdIBb1bcNSWIdX+TBcpojAtDhuu+t1L4nuDhOYpAbENY3k3ffkh7CA7PaNk
.u.WRWfmh6JHY7E+zIulvFwuQtIJVIOHxsGsjeThaRW4djope+QcwRZzoIj2
fZf.YRb+X8p0C7Qcc2Ddj.zkmNgg4TuIeyO3zpDmYLkF9.pfa96.x4gqr5m1
4WLVmLgDOtpf3oV6ulqYZcEnX4kp9QMILxMpKpSvk7R5qdI+CFzuWee3TGBL
u1bjp+KXOPrCA9FDRLGQXPWv6aNBf2q7eUljoO3ggPCFMFXdsVKK52A2l.+o
muUY79wh+I4fc1WTdEuLisfenJliZJD0i1b8AiafLYpCjGpVdKLatIjoT8RR
m532UY0hktaOQ6+E2zqrtZAGXErrMJgBtZEmoqM2FQug3s42nDW+tg3o3Jbz
nz2aBNK4LqCasalJ4TkoaKyL.ARyYUm5OgBjvSQMNCNIe655QT2Xr38j32qO
+kk0LjhbNEzvS2NTa0dM2PyUrZsbQFmUMjSIJHNvMo6wk4aNBXRvDV.X+65w
9V1qW5mtPaKNLs+RBqIGQ6LXaMlvyy8kbkVTXuXwNChzLlc5SFpgHCvNls5e
zFxr43dsj+X.I6GgzikL6kYbrTeXZqq7nrj4BW50RIiA6Yttidsz1oywYog3
m1NcNJKYNk29wzKclxJygYZJC73Lc7..YzXDfs8ibXKMFNtngHFsbN4XSZLH
LEepjHAQ6VhPNdIxfnyiEjCIE717zGmgRNUIFoQCwRiQRD5PbSiB4ENj0uBF
KK0KjFivKxfDDgiAlFRJCxnHHFxp+jWiolhCYkk2wqTsi1ZDrt4ak1DJ1qwx
AKtr4u1806TwuSrc7g1VXUXQwZrhXb6j1pSen89LcL2wZUQsnM6DBOzj1ZxK
X4bUIqAI1R2O+Gm+enjjwJ.
-----------end_max5_patcher-----------
1 Like

In general, I meant with “ears”, though in the case of the sine wave example (550Hz), correct=input. It’s obviously more subjective and perceptual with acoustic sounds.

I guess I meant having some more “vertical awareness” in the matter. For example, if I run that same audio file into sigmund~, I obviously get some wiggling around, but it hovers/finds 126Hz to be the fundamental. I don’t know the maths of what’s going on under the hood there, but I imagine it takes harmonics or at least octaves into account when determining what the fundamental is?

At the moment, using confidence weighting, it’s basically saying “I’m certain these pitches happened at some point in this file”, but there’s no way to figure out the relationship between them (harmonics) or make a meaningful(ish) (gu)estimate on what summary statistic would work best (mean/median/min/etc…).

Thanks for the mode thingy!

Testing it out on these sounds is interesting.

For the sine wave, I get 530Hz as the modal bin, which is slightly closer than 523, but not quite 550. That could be a bin width/resolution thing though.

Interestingly I get 390Hz for the metal sample (from my last post), which is a pretty prominent harmonic, so in that sense the mode picked out something more, um, “perceptually accurate” than the vanilla summary stats. This is without confidence weighting either.

Curious what you used here. I first used spectrumdraw~ as it was kind of hard to ‘unstick’ my ears from the harmonics, and that got me down to 125Hz. In checking again now in iZotope I can see the lowest harmonic is that 125Hz one:

I mean, I see some fuzzy stuff under that, but it doesn’t look like a harmonic of the sound, but rather noise/bin funny business.

But you said it moved around bit, yes? So the number of frames where it’s != 550Hz is presumably significant. If you want to privilege stability, I guess you need an additional feature based on the derivative of the pitch.

Because I’m looking at the low end of the spectrum, I cranked the fft size somewhat. The same would apply in RX (like if you turn on reassignment, multires, huge frequency overlap and all the other bells and whistles, you’ll start to see some detail down there).

That said, I would put too much stock in that as a precise or necessarily meaningful number. The min just means that there was a frame at some point that reported that (but it’s also not a coincidence that this happens to be 2X the bin spacing). The 0-centile isn’t affected by the weighting : it’s always the lowest value in the sample (ditto resp. 100-centile). However, all the other centiles are affected by weighting (hence it making a difference here).

Suggestions:

  • Try stripping outliers in bufstats if you’re not
  • If you’re using 1024 win go bigger for more meaningful analysis in the low bins (126Hz is still only the 3rd bin)

Aggressive settings with your file:

Yeah, the overall amount of time it spends at 550Hz is less than half, but it is the single longest stretch of a consistent pitch.

Hmm, a derivative of the remaining bit would be handy. Perhaps finding a section with the lowest derivative could give similar results to finding the mode.

I had no idea about this stuff! Jesus:

I feel like I’m looking through the code in the Matrix or something. I’m so used to seeing these kinds of representations get blurrier the lower they go.

Yeah that definitely looks good. I still think there are cases where some kind of “vertical” awareness, or a way to parse through that information in a contextually-aware way would be useful, but this covers a lot of ground in terms of “finding the fundamental”.

I still need to strike a balance with this stuff as for my main analysis (256 samples), pitch is largely not present (in noisy percussive sounds) or when it is, given it’s only a few frames of analysis, it’s not terribly reliable.

Perhaps this will be useful in the predictive analysis “time travel” stuff where I have no pitch vector in the 256 sample analysis, but I include pitch in the 4410 predicted version.

Even then, for percussive-y sounds, I wouldn’t say that pitch is of equal significance as “timbre” or loudness.

this was the reasoning - @rodrigo.constanzo let’s not forget that what I say is always hypothesis and might lead nowhere, but I said that exploring weighed Q1 (25%) could be interesting if pitch confidence was thresholded.

Modes are problematic (like in chroma) because they imply classes and therefore quantization of the space… otherwise you will not get the correct values for certain.

that is what I have suggested in every of the past 3 meetings :wink:

As an “always” thing, yeah it’s not great. But at the moment, confidence as the only weighting is super quantized, just to “whatever pitches happen to happen inside the analysis window”. Having something that works off some kind of pitch structure would be useful, or, as I said above, something to be able to assess the pitches you are given from confidence weighting.

I don’t understand what you say here: it will always be ‘whatever happen to be in the window’ but in this case you can decide what is valid.

This is what threshold weighing on confidence does: if it has a pitch that is valid, it passes it. Whatever you want to find after that is yours to try. I told you there is nothing that will work all the time. Peaks will have to be thresholded, modes will have to be quantized, etc etc etc.

looking at the spectrograms above, I reckon you should analyse pitch with a high confidence thresh after the first 100ms.

more importantly, you should look at the pitch and confidence curve at scale - i would guess that you don’t get anything valid for at least that length.

As in, there is no way that I can think of to pick of the pitches that have a high confidence, what would be the right one. Unless I’m going to do it manually for each, but for that, I’ll just pull out a cycle~ and tune by ear. The idea would be to have it batch through things in a way that I personally couldn’t.

Like above, just running the audio through sigmund~ gives me something that is more perceptually correct (i.e. the fundamental). I think it can do this because it is looking at all the vertical frequencies and making a choice based on that. I’m guessing YIN is doing this too, but on a per-frame basis. The problem, that I’m trying to point out, is once you have separate “pitches”, that context is lost.

For this particular file, that’s definitely the case. But again, if I’m drilling into that detail, per-file, I can just do that manually. If I’m dealing with acoustic sounds, there will be some where the fundamental is louder at the start, some where its louder later, so I’m not certain that time segmenting it will be useful (across the board), in the same way that looking at the remaining frequencies “together” in a chroma-esque way might.

Obviously there is no one-size-fits-all, but trying to carve out a one-size-fits-best (for acoustic-y sounds) is what I’m after here.

yes, I prefer sigmund~ too for certain sounds. our yin implementation is better for other sounds. @groma knows that. so for now, you can run sigmund~ if it works better for you.

I like what I get from yin, and have switched all my other pitch tracking to it. I just mention that to point out that you can’t sigmund~ or ‘yin’ the results you get from confidence weighting. At that point you have “single pitches in space”, separate from their time.

If you could then re-yin the results of the confidence weighting, that would be cool! (e.g. filter pitches by confidence, and once you have that, run those pitches into yin and have it say “the fundamental, given these pitches, is x”).

what you propose is what both yin and sigmund do under the hood, differently, and both get different results in various cases where they are better than the other. (the search for peaks and try to find harmonic relations)

For missing fundamental stuff I also have better results with sigmund. for inharmonic, it’s 50/50. for harmonic, they are both good.

Exactly.

Except, you can’t do that when you have a buffer with isolated pitches, after being filtered by confidence.

Hmm, can you then, um, run the confidence-weighted buffer (with gaps and all in it) back into fluid.bufpitch~? I guess that may lead to weird values because of frames and incomplete frames. But that’s sort of what I’m suggesting. To be able to do “something like that”.

you can’t because both algo do some sort of time-series of peaks to estimate the most probable fundamental. you then get a single guess which is wrong except when it is right.

btw, I vaguely remembered a thread where you two @weefuzzy and @rodrigo.constanzo were looking for interpolated peaks in a series, some sort of js was pointed at for interpolating and peak finding, or did I dream that? Otherwise I’ll try to roll in a quadratic interpolation of spectra in js

1 Like

There was some stuff ages that @weefuzzy helped with that approximated some of this weighted stuff. I tried to find it when making this post, but I guess it’s just a single post in a perhaps tangential thread or something.

I was also thinking today of “double dipping” the weighting, where you weight by confidence first, to avoid problems like in your modular thing where the loudest bit has low confidence, but then apply a loudness weighting to things that pass the confidence weighting. So, in effect, you would have the loudest pitch where the confidence was high.

Wouldn’t solve the harmonics/fundamental problem, but it may be more perceptually meaningful than a straight mean/median (or any other centile), as those stats would be decoupled from loudness/perception.

It’s a bit of a brain twister (for me at least) to think about this. I guess the idea would be to analyze the segment for pitch/confidence, and loudness. You then threshold/trim by confidence, and then with what’s left, further threshold/trim by loudness? Maybe a logical function between the confidence and loudness? This is where I’m a bit lost, otherwise I’d build the thing.

1 Like