Ok, I can see this being very useful. Here is the same 4D dataset “rotated” through each permutation (i.e. the same exact dataset just swapping X for Y, Y for color, etc…)
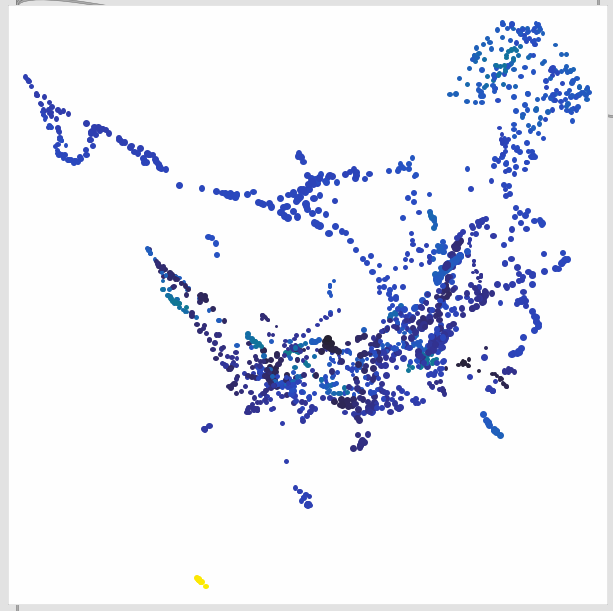
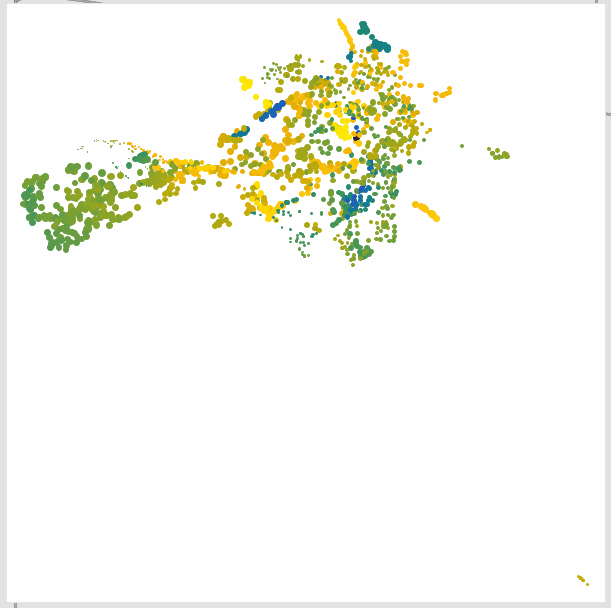
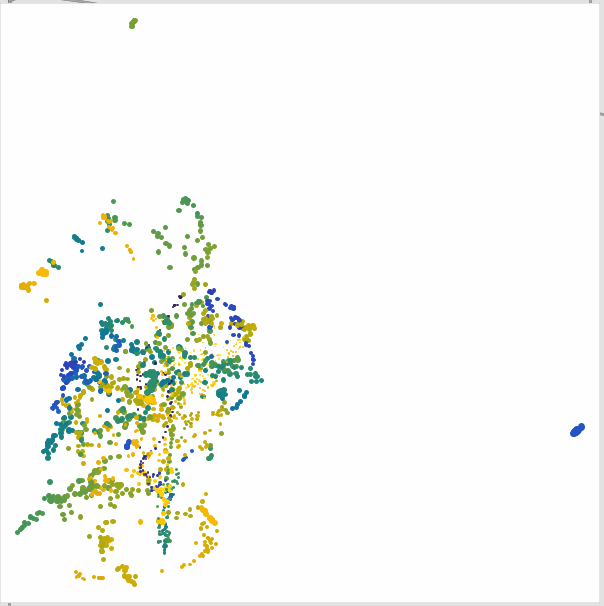
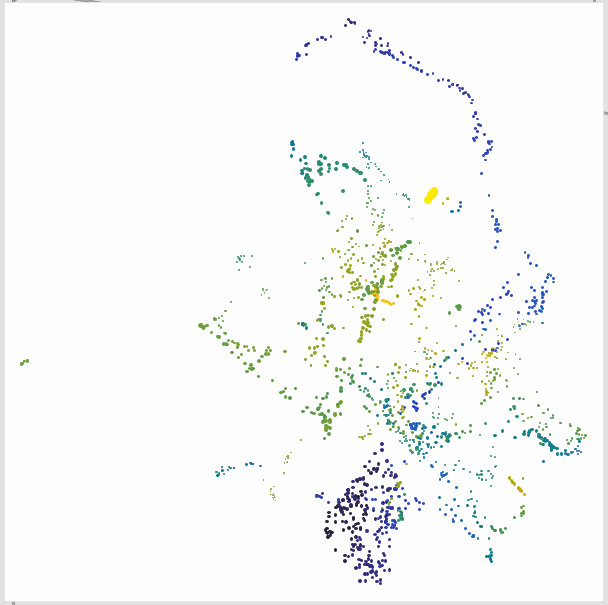
This could be quite useful for even 3D stuff as you can test the clustering/neighbors too.
At the moment I’ve implemented it with a simple rotate message. I thought about adding an argument but then you need to explicitly know how many dimensions are in your dataset, and how much you want to rotate it by. This way you bang a single message and it jiggles it. I also added rotate reset to bring it back to default. It also resets to default every time you load a new dataset.
I’m not convinced that’s the best interface, so open to input here as far as what terminology is best. There’s probably a real name for this kind of thing anyways.
Now onto the more sticky but:
I got all the above coded only to realize that the internal fluid.kdtree~ doesn’t remap, as that’s being plotted according to the original dimensionality. So it actually needs to get rotated at the dataset stage.
I’m sure it’s presently possible to do this with chaining together fluid.datasetquery~s, but it seems really tedious.