I’ll need to change the maths though - I’ll improve. But this is as far as I’ll go with this for now as we need to focus (on scaling with curves and caps for instance)
1 Like
What are people’s thoughts on 4D visualization?
Wondering if adding point size as a 4th dimension is useful at all?
@tremblap mentioned using alpha/transparency as a 4th dimension, but that seems like it would just occupy a “color” space either way, plus points will literally start disappearing if they get too dim.
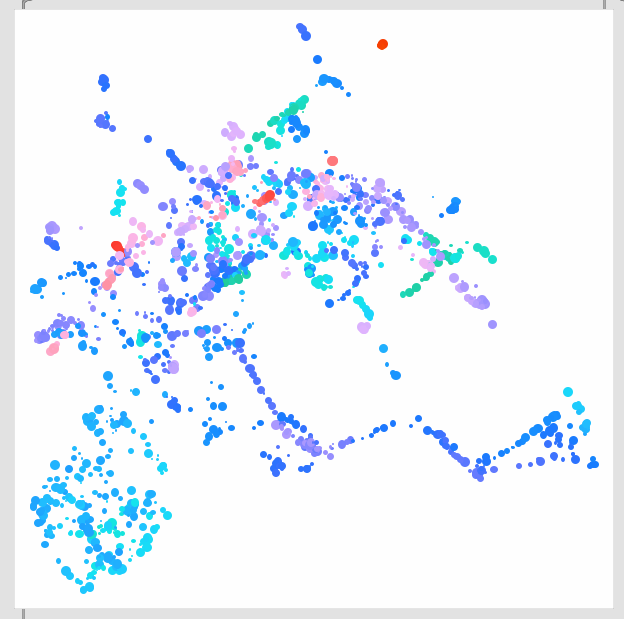
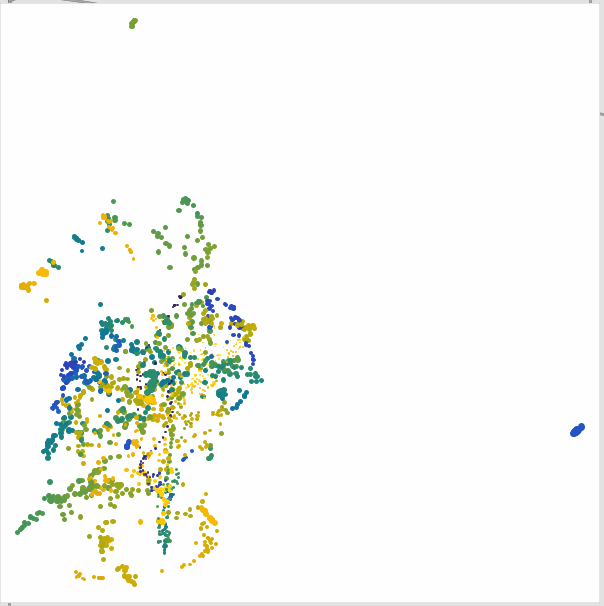
This is a mockup from the example dataset posted earlier in the thread, but with me generating a random size between 0.5 and 2.5 for the point size. I tested going bigger and smaller, but this is about as far as I could push it without it looking bad. Without adding outlines to the circles (way beyond me), similar colors start melting into each other and kind of defeats the point.
I think keeping the “puck” the same size is still a good way to go though.
Ok, screw it. I added 4D as size. Easy enough to ignore if you don’t want it, but now it will happily parse up to 4D datasets.
I also went through and tidied a bit more.
datasetplot4D.zip (393.1 KB)
1 Like
the problem for me with 3rd (as colour) and 4th (as size) is that they only work in my head when each of these dimension is self-standing - what I mean by that is that when you have LPT as 3D you can seen patterns of whatever dimension you have assigned to colour, but when it is a 3rd or 4th dimension of a latent space where the sum of all 4D means something, then I find them more confusion than helping.
So for a CataRT 1D = 1descriptor, it works in 4. but for latent space, it doesn’t help for me. A fake 3d object I could manipulate would probably be more helpful, and I might attempt that with the jit environment.
1 Like
Not played with it a ton yet, but it’s definitely not as clear as color, and that’s not as clear as X/Y. I think ultimately having multiple visualizers would be helpful to interrogate the data.
I also thought having a “rotate” message may be useful too, where it just, um, rotates the dataset over by one value (e.g. X=Y, Y=color, color=size, etc…) so you can view the same data in a couple different approaches quite easily.
Is there a native/easy way to rotate the contents of a dataset (short of copying each chunk over one piece at a time, which gets complicated if you can have 2, 3, or 4 points in the dataset)?
With this as it is, it’s easy enough to just feed it 2 or 3d if you want, and ignore size. It at least does something if you have a 4th D.
not that I can think of. but because this is all mapped manually in a dict dump, it is quite easy to do in the patch either with zl.rot to start with or a discrete mapping.
1 Like
I guess that’s true. It does end up in list-land at the last step. I’ll have a quick poke and see cuz that could be very useful for looking at it from “multiple perspectives”.
I think rotate may be a bit misleading though, as it would seem to refer to the visual projection rather than the data. Though I can’t think of a better name for that.
I also found a bug where changing the size doesn’t resize the points anymore, so I need to find out where that broke.
And finally, it may be useful to redo the actual drawing in jit.mgraphics since it will potentially allow for loads more stuff (e.g. stroke on the points for showing diff sizes, or even shadows etc…). Plus, I think jit.lcd may be deprecated, or en route to at least.
Ok, I can see this being very useful. Here is the same 4D dataset “rotated” through each permutation (i.e. the same exact dataset just swapping X for Y, Y for color, etc…)
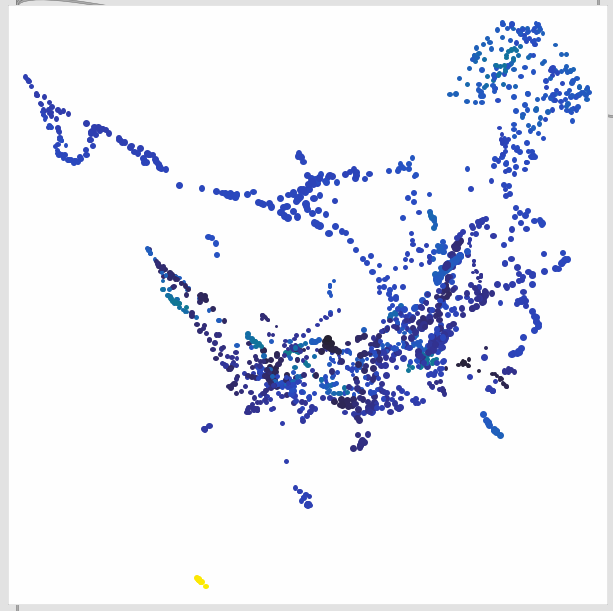
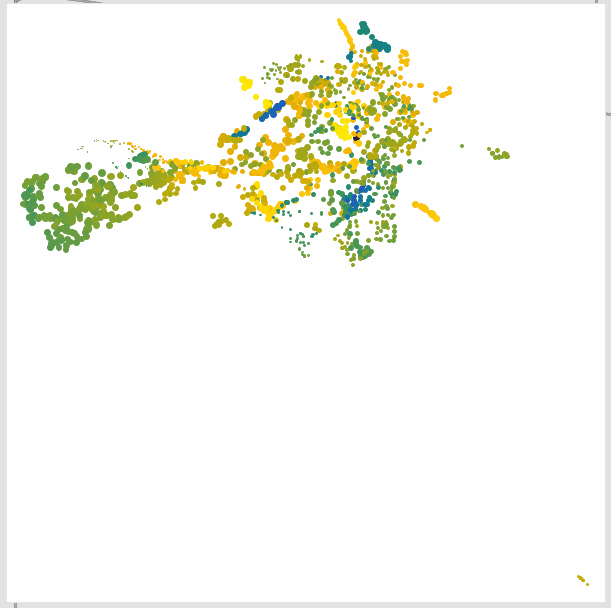
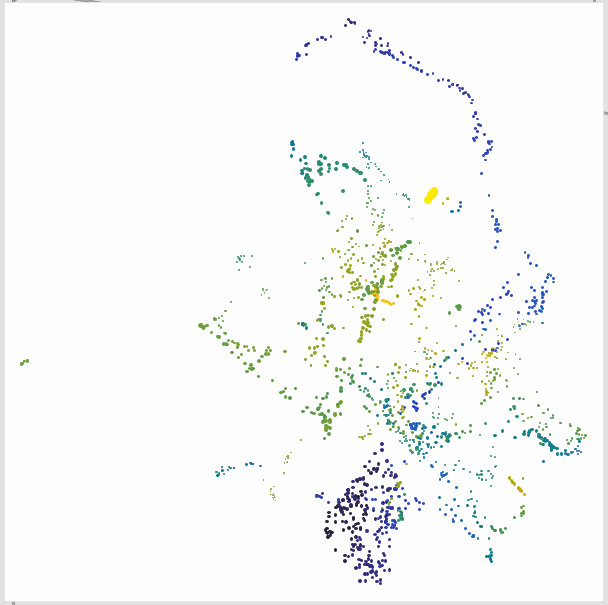
This could be quite useful for even 3D stuff as you can test the clustering/neighbors too.
At the moment I’ve implemented it with a simple rotate message. I thought about adding an argument but then you need to explicitly know how many dimensions are in your dataset, and how much you want to rotate it by. This way you bang a single message and it jiggles it. I also added rotate reset to bring it back to default. It also resets to default every time you load a new dataset.
I’m not convinced that’s the best interface, so open to input here as far as what terminology is best. There’s probably a real name for this kind of thing anyways.
Now onto the more sticky but:
I got all the above coded only to realize that the internal fluid.kdtree~ doesn’t remap, as that’s being plotted according to the original dimensionality. So it actually needs to get rotated at the dataset stage.
I’m sure it’s presently possible to do this with chaining together fluid.datasetquery~s, but it seems really tedious.
I tried quickly but I hit the wall. I am no specialist of that interface so I was thinking of making a navigatable ‘real’ 3d version instead when I bite the bullet (as stated above)
indeed this is where the 4d of which only 2d are used despite trying to visualise 4d is complicated. Another interface for 4d could be 2x2d (2 spaces) which query a 4d object by taking the 4 distances, but again it is complicated to visualise…
1 Like
As a drop-in replacement, it didn’t look massively different from jit.lcd. It’s on my list of things to look at as that could then open up more possibilities for complex visualizations.
The browsing sounds is a bit of a perk really, so 2D (out of 4) feels ok to me, as you can see the other dimensions. Something that rotates, or is presented in another way would also be very handy though.
Having only 2D being in the kdtree makes some of the rotation easier (e.g. range 1 2, range 2 2 etc…) until you need columns 4 and 1.
1 Like
That’s what i thought… then after 30 minutes of trying I said I’d give myself more quality time to do it.
1 Like
Here’s an updated version that takes a rotate or rotate reset message, and handles rotating the internal dataset.
I unpack everything via a dict and rotate the contents before stuffing it back in. Faffy, but beats trying to do it via fluid.datasetquery~.
fluid.datasetplot~.maxpat.zip (48.1 KB)
@jamesbradbury just shared this with me, and it’s suuuch a super slick interface!
https://experiments.withgoogle.com/ai/drum-machine/view/
Would be great having mouse wheel zoom, and grab to move around. I almost wanted shift-click to do some kind of pan/orbit stuff too for 3D stuff.
this is what I had in mind. 3 real D. easy to do with the GL particule stuff in jitter, like demo level, but then I need the time to go there. I was watching this yesterday as a break:
")
one could do like they do (3d + label/colour as 4th d)
anyway, on the wishlist, for anyone who fancies doing the jitter particle tutorials, maybe even me when I reach that in my todo list in 2024 ![]()
1 Like
Yeah, that gets really nice. You can also do slick things like having the vertices drawing showing the numneighbors as you click/explore points.
This would be amazing for browsing and investigating sounds, but would actually take away from compositing/constructing things, as trying to select/replace/delete/move points in a 3D space becomes waaay more complex.
Getting somewhere with jit.mgraphics:
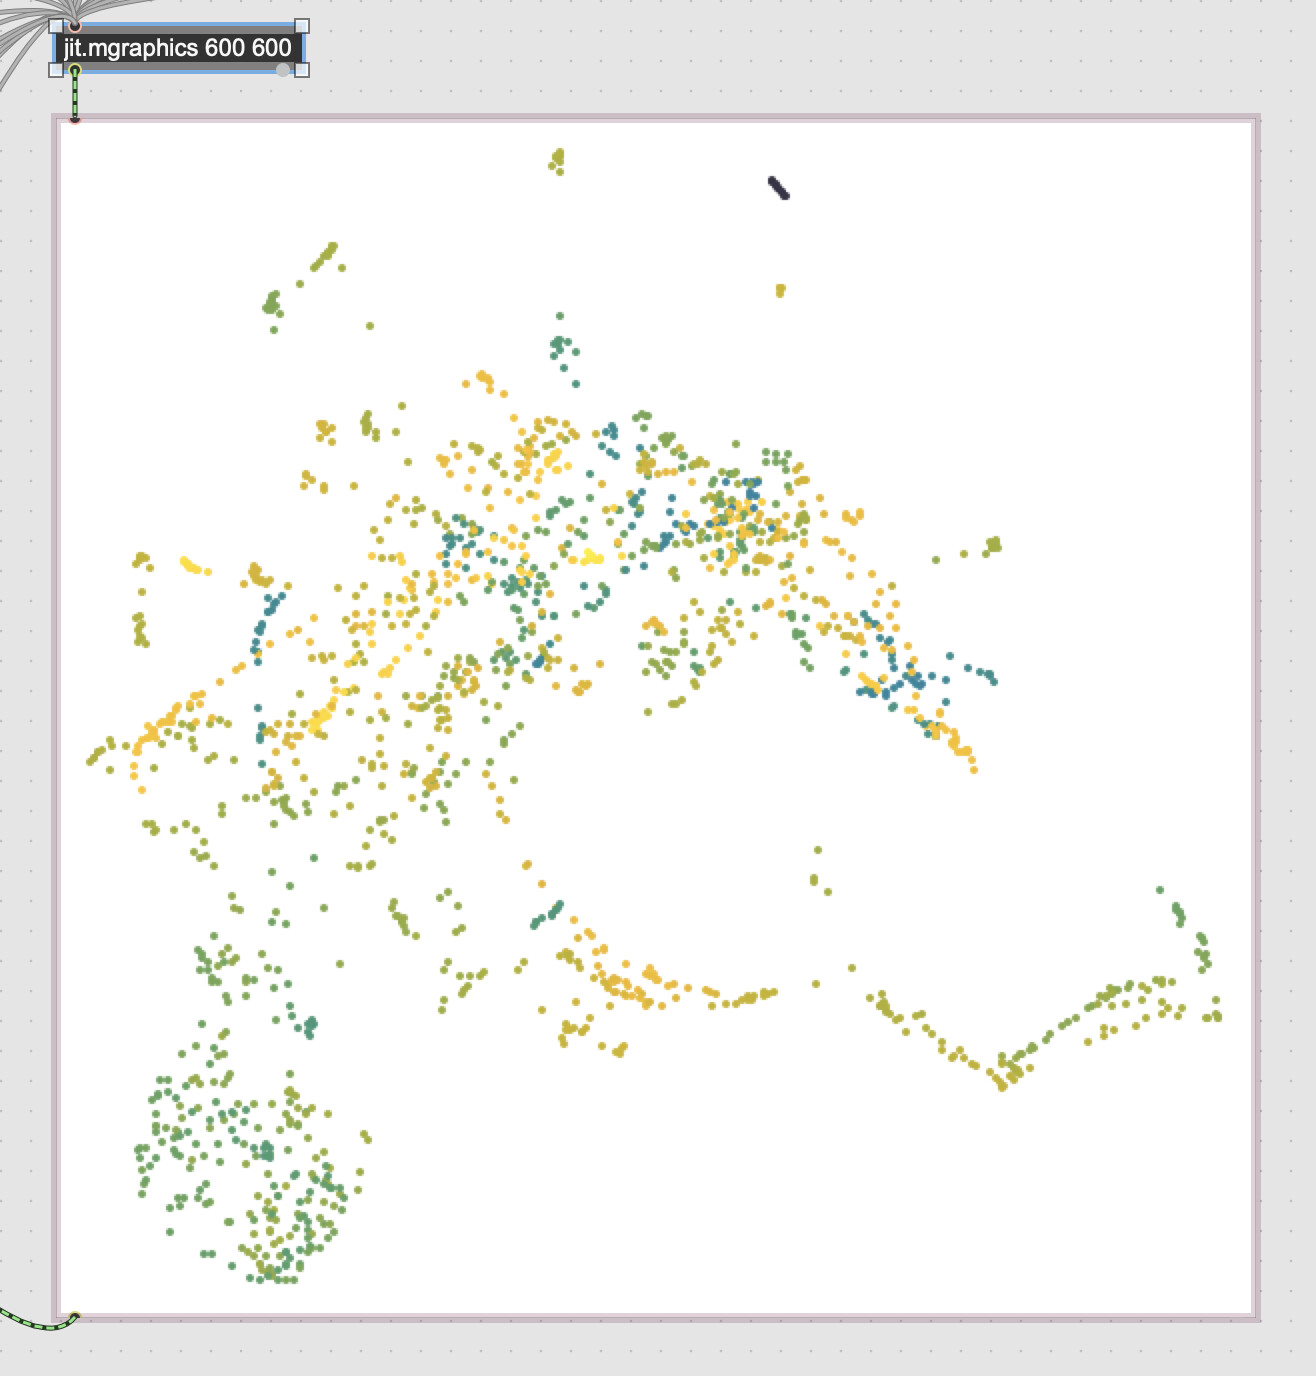
Message formatting is quite a bit easier too. Don’t need to handle the maths of start/end points, just start + size. Also loads more drawing options too.
1 Like
I find jitter stuff (particularly the more newschool jit.world stuff) to be so different and confusing. I was watching a bit of that video and thinking, that doesn’t look so bad… But I couldn’t any of the camera stuff working besides panning. No zooming in or out, and couldn’t even get the panning working if I set it up to work with a jit.pwindow as I don’t like having a floating window like that.
I’ve gotten the main body of drawing stuff working now in jit.mgraphics but still struggling with one of the initial problems I had. I can easily draw all the points in one process/jit.mgraphics, and then the red circle in a completely separate jit.mgraphics. If I try to combine them, I get the same problem I had before where I can’t really use a different background color because multiply/addition/etc… all modify the colors in an undesireable way.
What I can do is draw all of it using a single jit.mgraphics, which I think makes the most sense, but that means unpacking/generating/drawing all the points for every frame that the red circle moves. That seems wasteful and something that would generate a shitty frame rate. I can dump the contents of jit.mgraphics into a jit.matrix and then bang it when I go to redraw the red circle, but then I have the same problem as before, of combining the color spaces.
This is getting quite off topic from FluCoMa stuff, but what is the general way to do this? Unpack/redraw everything, every frame? Is there a magic jit.op that I don’t know about? Is this better suited for just having a jit.world?
we can talk about it later, but the idea is that you draw to the world in a given order then you render. I have not done jitter gl stuff for at least a decade so it is quite rusty… but in your case I think you render twice for nothing. I have not used the newschool jit.world stuff though, but you were drawing to a destination GL space which I think they have made a ‘world’.
for zoom in/out you need to use alt-drag iirc but again this was oldschool and I don’t remember if it worked in pwindows… hence me saying above that I’d need a day to go back to it, relearn it after a hiatus of 15 years (2006 was the last time for realz for this garage vid ) but I think I did other stuff after… anyway, that long ago is far out in my brainzzzz
1 Like
For the purposes of this it seems pretty straightforward. Less so for drawing connections between points etc…, but for just doing what presently exists but in real 3D (or up to 5D with color/size) it seems like it should be pretty easy.
Would be interesting to explore for sure, though it does get more complicated to select/remove things. Though what would be awesome with that is if you can “lock” any given 3D position in place, and then do 2D transformations on it (click+hover to play points, select individual points, lasso to delete, etc…).
Yup, that works. That’s quite different from all the other 3d/navigation stuff I’ve used. I tried all sorts of buttons/presses, but couldn’t find it.
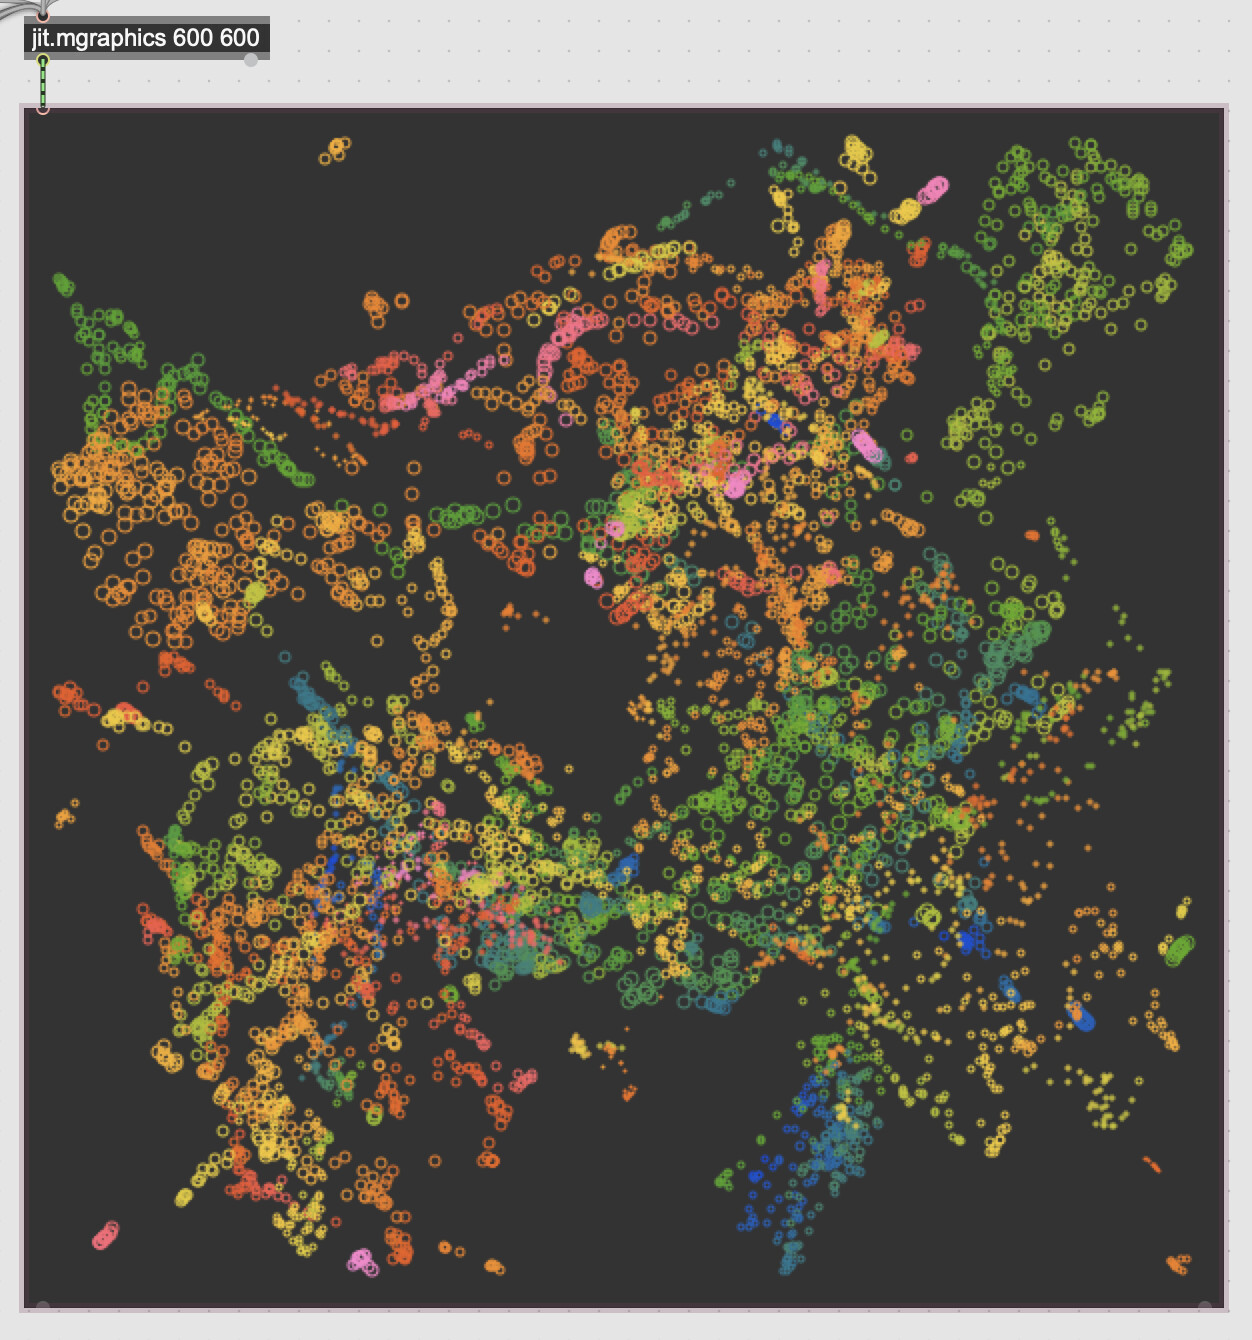
Had a great Zoom chat with @leafcutterjohn this morning. Getting something suuuper nice!: