Fluid.umap~ transform message

Hi,

I have some difficulties understanding the outcome of fluid.umap~ transform message.
I understand that the fittransform is used to create a umap model. Then, I was assuming that the transform message could be used to map entire database with a previously learned umap model.

As I have issues with the data generated by the transform message, I have made a small max patch that allows one to create a small dataset, estimate a umap model with the fittransform and then do an additional mapping of the dataset just using the transform message with the previously trained umap model. Here is the patch: TestUmap.maxpat (17.3 KB)

I was expecting to get the same results with the fittransform and the transform messages… but that is not the case. The mapping seems to be very different. So I guess that either I misunderstood the goal of the transform message or I am doing another type of error.

Any help on sorting this out would be more than welcome. Thank you very much in advance.

that is exactly what this is for indeed. You might have found a bug, so let me check it and see… more in a few minutes :slight_smile:

1 Like

Hi again,

I have made two additional tests:

  1. I have compared the mapping produced by the transformpoint message applied on the individual entries of the database. Surprisingly, it gives a third mapping. So I really do not understand the outcome of the umap.
  2. As I was wondering whether I was interpreting well the ideas of fittransform, transform and transformpoint, I have made the same tests with the fluid.pca~. Here, all three resulting mappings lead to the same plot. So I do not know what to conclude.
    Here is the extended patch with the additional experiments: TestUmap v2.maxpat (53.5 KB)

Thanks.

1 Like

there is definitely a bug, either in my understanding or in the object. I need to investigate in the source code now, give me a minute… if you happen to have an old version of the toolset if you can check it behaved there the same that would be helpful. I’ll have to do that too…

Thanks a lot for your response and your help. I do not currently have any previous version of the toolset. I will check in previous backups I made with an old mac. I may have a copy of a version before v1. I will let you know if I manage to find something. Thanks again.

no need to check - I’m in the source code and it has not moved on the lines I am not sure why there are in the transform (used on all 3)… the algo is split at a place I am not certain is the right one but as I am the least understanding of the (ex)team I will need to spend some time with the code.

It’ll take some time and usually @weefuzzy and @groma were right so it is probably on me/us to understand the stockastic aspect of the algo and how it can be used on material not trained on…

The first test I’ll do is to run the same code in Python. @tedmoore or @jamesbradbury might have the codebase to do so quickly as I think they both played with it in that language pre-flucoma-time

I have managed to find a version from November 2021. Same behaviour… So it is not a recent problem. Thanks a lot for your work!

1 Like

Hello all.

Just to update everyone. This behaviour is not a bug, and is expected and the same as the reference Python UMAP implementation… except when you fit the original data. This is because the model is optimising the solution all the time, and the reference implementation checks that the data is not already existing.

They are ways around it (another type of UMAP implementation) but the timescale of volunteer work to add this implementation as an option is unknown.

Now, if you want to read a bit about all this, this is the explanation I was sent by @weefuzzy :

To understand why it is not deterministic: Are umap transformations non-deterministic? · Issue #158 · lmcinnes/umap · GitHub and UMAP as a dimensionality reduction (umap.transform()) · Issue #40 · lmcinnes/umap · GitHub

The eventual solution: Parametric (neural network) Embedding — umap 0.5 documentation

More soon-ish

2 Likes

Hi,

Thanks a lot for the update. I understand that quite a few people have been using the UMAP and have not found any practical problems with it… So, I may be using inappropriately the transform. Let me first explain the use case I have in mind.

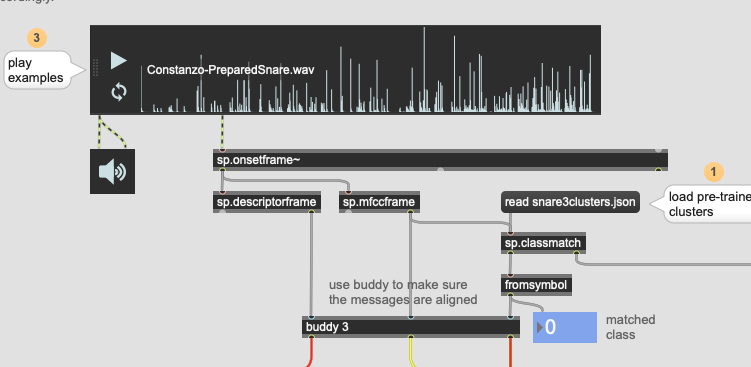
I have a database of piano recordings with about 10 playing techniques which lead to quite different timbres. I characterize the timbres by computing mfcc coefficients and some spectral features in between two successive onsets. The statistical analysis of these descriptors leads to more than 100 values per interval and I would like to represent the timbre as a point in a 3D space. So, I use the UMAP tool to create a mapping between the 100+ descriptors extracted from the audio to the 3D space. This results in 3D points cloud and I can see how the 10 different timbres are more or less clustered together in the 3D space:

Screenshot 2023-04-28 at 11.15.10
3D representation of the timbre. Each color represent a specific timbre resulting from a playing technique

Once this mapping is defined, I would like to use it to characterize the sound of a piano in the context of a live event. As I would like to use the same mapping as the one trained on the database, I was thinking to use the transformpoint message to see whether the current timbre of the piano was close to the representation of the timbre extracted for the database. But doing this I also noticed that event if was using as live piano the audio that was actually used during the training, the mapping was somewhat inaccurate.

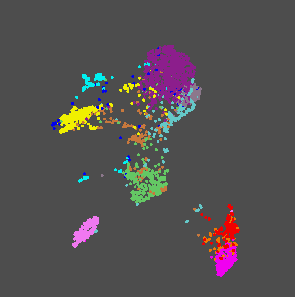
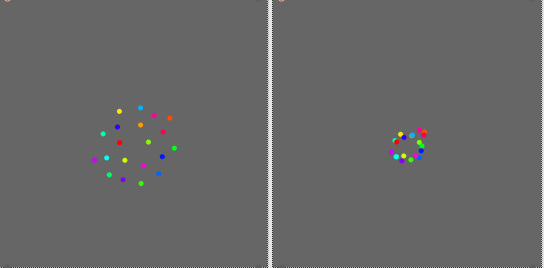
So I started to look more closely on a simple case. In the following patch, I am creating a toy dataset of 20 points with 3 values and I use UMAP with fittransform message to project them in a 2D space TestUmap.maxpat (41.6 KB). Once the mapping is defined, I map again all the individual points of the dataset with the transformpoint message. Here is a comparison between the mapping with fittransform and the one with transformpoint. As you can see they are related but quite different

Screenshot 2023-04-28 at 11.01.09
Left: fittransform mapping, right: transformpoint mapping

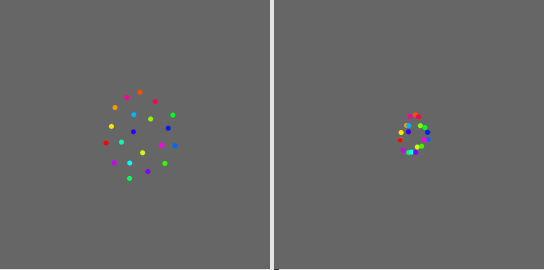
I understand that there is a stochastic aspect in the transform. Each time I apply the fittransform I get a slightly different result but the relative positions of the points are the same. Here are three additional examples.

Screenshot 2023-04-28 at 11.01.21

Screenshot 2023-04-28 at 11.01.55

Screenshot 2023-04-28 at 11.02.17

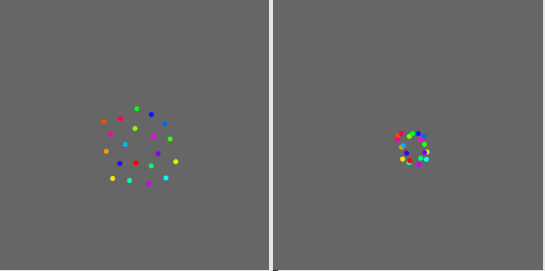
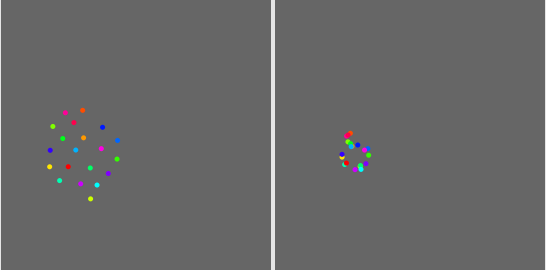
Now what strikes me most in this experiment is that the result of the transformpoint is not simply a small random fluctuation around the fittransform results. There seems to have a constant bias in the shape. In particular the range of values seems to be always smaller with the transformpoint results.

So, I am somewhat confused. I am doing something wrong with the transform or is it really how the transform is supposed to work?

As always, thanks in advance for your feedback and comments.

I’ve not followed this thread super closely, so I may be missing something about the specifics of your setup or approach, but it seems to me that you’re describing a classifier here, rather than dimensionality reduction.

You can obviously use dimensionally reduction as part of the recipe for classification, but in my testing/experience I got (significantly) better results without using UMAP (or PCA) first and just feeding the MFCCs + stats (104d in my “recipe”) directly into a classifier. Although it is an old (and long) thread, I go through my tests/processes/comparisons in this thread. The main outcome was that “raw” descriptors/stats worked the best, and for me it was a matter of finding the right combination of stats and freq range to get the best accuracy.

For a quick test you can use sp.classtrain and sp.classmatch from SP-Tools to see if that does what you want, and if so you can then refine/customize the specific descriptors that work well/better for piano.

If you don’t want to specifically define classes you can use kmeans/clustering to find however many points you like, and then use that to feed a classifier (sp.clustertrain in SP-Tools for quick testing as well).

At the moment I’ve been experimenting with using an MLP version of the classifier which needs to be trained/converged before use, and have found the results better/faster too. (this is not implemented in the release version of sp.classtrain, but the dev one has it built in if you want to test that.

1 Like

Thanks a lot Rodrigo for your comments. Your experience is very helpful! I will look at the threads you are suggesting.

Concerning the classification aspect, I can say that this is indeed partially true. For some aspects of the system, I would like to know whether the current live piano playing matches one of those used during the training. I am doing this with the search of nearest neighbours (KNN, KDTree) in the 3D space.
But on the other hand side, I am also willing to modify some of the parameters of the system, in particular of some synthesis modules that generate an audio in response to the current piano playing. So the XYZ values characterising the timbre of the current live piano are used to modulate some synthesis parameters.

Anyway, maybe I can do this also with one of the approaches discussed in the threads you are suggesting. Thanks again!

1 Like

Are you calculating this manually? That’s essentially what fluid.knnclassifier~ is doing (finding the nearest match with a KDTree)

If that’s the case I’ve also gotten really good results from having two parallel sets of analysis. Using MFCCs+stats to go into a classifier, as I found that to give me the best results, then a separate spectral/loudness/pitch (e.g. “perceptual” descriptors) analysis which I route around based on what class is matched.

Basically something like this (in an SP-Tools context):

(this is from the sp.classmatch helpfile)

Since MFCCs are quite abstract I didn’t find them terribly useful for mapping onto parameters elsewhere, even a 2d/3d reduction of it so I prefer using centroid/loudness/etc…

Loads of info in there, if a bit out of date (the code examples may not work anymore since the syntax has chnaged over the years). It would be worthwhile testing/validating your process too, to see what gives you the best results. Doing that is what led me to the realization that (for my use cases/material types) raw MFCCs+stats worked significantly better than any combination of UMAP, PCA->UMAP, PCA, normalized, standardized descriptors, etc…

Hello!

A few thoughts that might help:

I wonder which features you used, and how you deal with time. This is an obsession of mine and I have a few bespoke approaches but any sharing here is welcome.

So the classes are manually labeled in that first graph, and associated to colour? If so, your descriptor space is really efficient. I wonder if you zoom in the space how the liminal spaces are behaving. 100D to 3D is usually not that good. Also, using PCA before your umap to reduce your 100D to something smaller might help remove some of the noise and redundancy. Finally, I’m curious if you normalised or kept the MFCCs and other descriptors at scale. Please share your workflow, you will find interested (and challenging) readers here :slight_smile:

So you want to classify. For this, liminal spaces will be important, and UMAP might induce more errors (deforming the space) than you need.

What I would try now is a completely different approach, that might work better.

100D → PCA → mlpclassifier

there are a few hinges in this:

  • 100D: should they be normalised, standardize, or left alone (3 objects in our tool suite)
  • PCA: how much varience to account for (the object tells you when you ask for x dims. if 12D gives you 99% of your data variance, the neural net will be happier to converge on this)

This method, tweaked, is in effect what @a.harker has used in his piece to split between oboe multiphonics. It worked. You can read about it in depth here, including demo patches.

For this, I’d like to test the same data with python. Can you provide me with the datasets so I can reproduce your results in Max (or SC) then see if the official implementation gives us the same range of variation? For the test patch you sent, it was in the same range but it was a toy example.

I hope your project goes well!

I was trying to find the exact code snippet and couldn’t quickly, but pretty sure it’s in this thread where @weefuzzy had worked out a thing where you specify the amount of variance that you want to keep (e.g. 95%) and then the PCA will give you however many dimensions that takes. This beat manually requesting x amount of dimensions from PCA over and over.

All that being said, in my tests I always got better results just training the classifier directly on the raw MFCCs, but the approach @tremblap outlines above (pre-cooking, then PCA->UMAP->MLP) is more conventional.

it depends :slight_smile: This reminds me of the xkcd about scripting - how long does writing a script will take vs the task it tries to replace :smiley:

anyway, MFCC pre-cook is indeed controversial. I like them all for various reasons.

1 Like

Heh, you know me and generalizing things out!

I just got tired of guessing each time, particularly since what I wanted was “keep 95% of variance”, and definitely not “keep 15d”.

For clarity the oboe multiphonic detection doesn’t use mfccs at all. Nor does it use dimensionality reduction in any way - it matches on a dynamically compressed and normalised spectral frame that is averaged over the training audio for each point. I have been using those things more recently, however, on some vocal samples.

As far as I can see here on a brief skim Philippe actually has a system that produces relatively clear clusters, but there is an issue in terms of the reliability (or understanding) of transforming points from new data into the previous space, and the fact that the mapping of individual points compared to a full set does not produce the same results and this discussion seems to have been side-tracked by more general advice, that while interesting, isn’t getting to the heart of that matter.

@tremblap - Can you download the TestUmap patch and:

A - confirm if the results you get are as above (they are for me)
B - if there is a bug here, or an issue of misunderstanding.
C - explain why transform produces different results each time

The core question (as I understand it) is "why do the two displays not look the same?) The possible answers would seem to be:

1 - they should do (there is a bug)
2 - they shouldn’t look the same (and this is why)

I think if you could answer that question that would help Philippe and/or lead to a bug fix that would benefit the community. My head has been out of these objects for a while, so I’m not in a position to confirm whether this is a bug or not, but I can understand what it is that Philippe thinks should happen, and I’m not currently able to disentangle it all myself.

1 Like

FWIW - if I run transform to output to a different dataset (not DatasetReduced) then the results are consistent each time (and the same as the original fittransform).

If I delete the DatasetReduced dataset after calling fittransform then further calls to transform produce randomised results.

Does fluid.umap~ rely on the output dataset for fittransform for future transform calls? If so I’m not sure that this is documented.

The references above explain why this is not a bug as this is exactly how the official umap works. I need @philippe.salembier data to see if I get similar deviation than in Python but on toy examples I do.

Which part is not a bug? - there are more than one issues mentioned here. It would help to be specific.

1 - Transforming the whole data set does not produce the same results as transforming the points one by one (that definitely seems very odd to me, if the patch is indeed correct)

2 - Under certain conditions transform (rather than fittransform) produces inconsistent results between runs.

I would totally expect fittransform to produce a randomised mapping (with consistent shapes, but not deterministic. I would not expect transform to do so.

@tremblap can you please check the patch and help explain what is happening - for Philippe as well as my benefit.