I was initially gonna bump some old threads I’ve made around the subject, but those tend to focus on more feature-request-y things, so here’s a separate/new thread, with some questions at the bottom.
Over the last week or so I’ve been coding up an offline/realtime analysis pipeline which focuses on creating a descriptor space of Loudness, Timbre, Envelope, and pitch, with the final one being less significant than the others. I’ve gotten something working alright (code here) and finally managed to build the realtime counterpart last night.
With that, I decided to test/benchmark it against my previous workflow. Now this isn’t a fully comparable comparison as my previous workflow allowed selective weighting/biasing and this new workflow has loads of dimensions/descriptors, but it’s at least in the ballpark of “analysing stuff and finding the nearest matches”.
My previous entrymatcher-based approach:
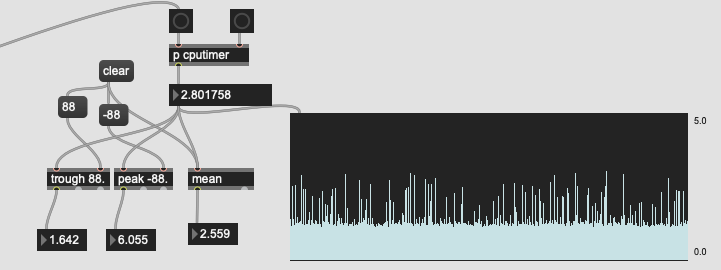
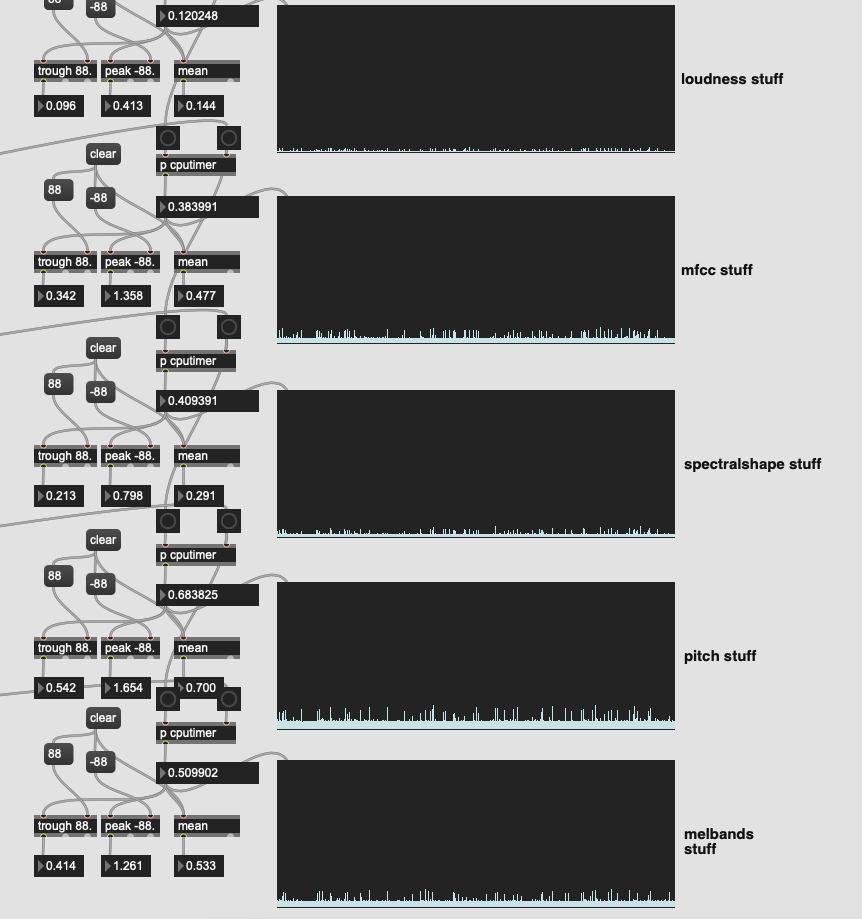
(I appologize for the sloppy code here, but you can see the min, max, and mean for each, as well as a rolling multislider scaled from 0. to 5. and all numbers are from after the onset detection window waits for the JIT delay and when a message is returned to the sample playback patch)
Here is the initial results for the real-time version of the LTEp patch:
Not bad at all! I purposefully put off checking the speed as to not be discouraged and to just build a thing that works. But in looking at this, it’s much closer than I had anticipated. I was expecting 10+.
So I decided to check and see where that time was going in my LTEp pipeline:

Surprising, to me at least, most of that time was being spent on the descriptor/stats analysis. I would have expected a bigger footprint coming from the transformpoint and knearest steps.
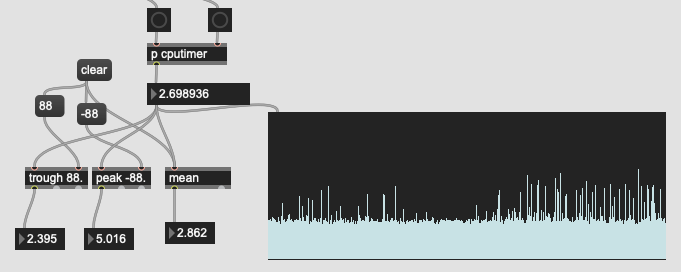
So I drilled down into the pipeline to see what was happening:
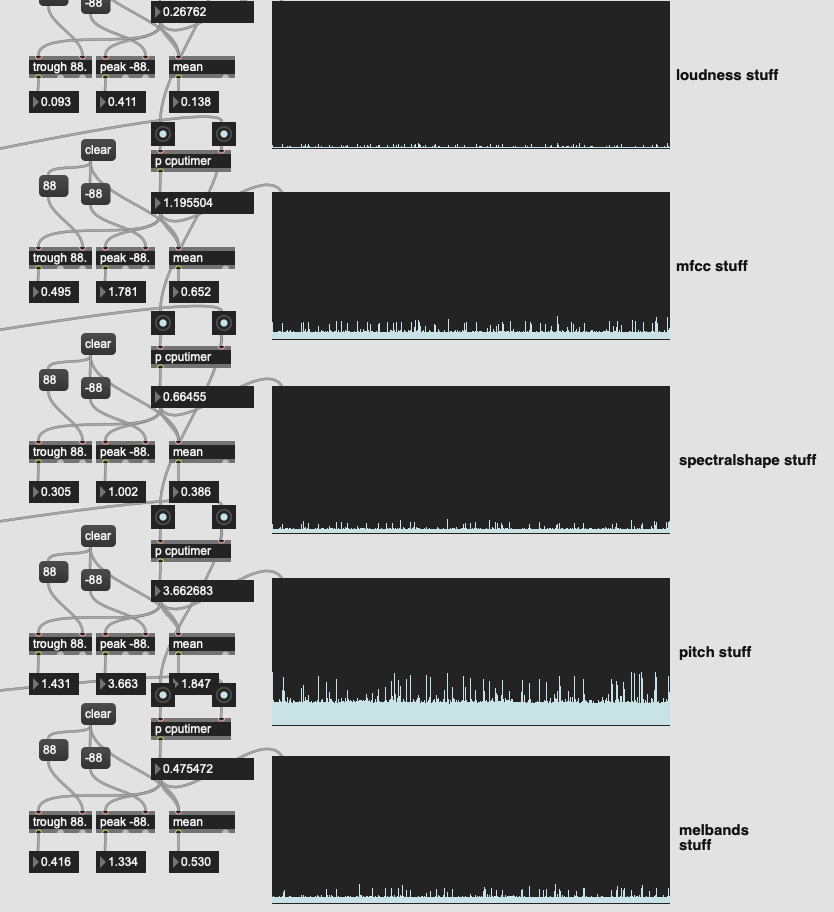
Look at that greedy greedy pitch!! Over half the time of the descriptor analysis is going directly to pitch analysis, which is not very important in my overall framework/concept.
I remember @tremblap saying that YIN, while good, is a bit expensive. So I went into the fluid.bufpitch~ helpfile and compared the speed of the different algorithms.
YIN:
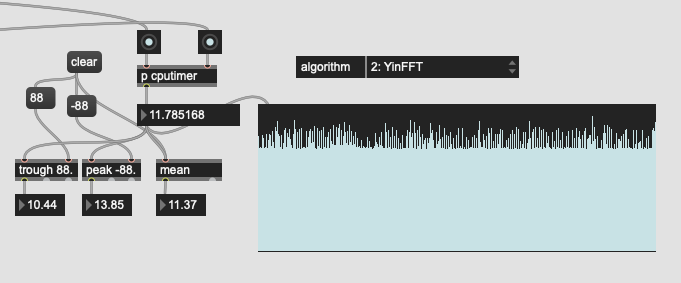
Cepstrum:
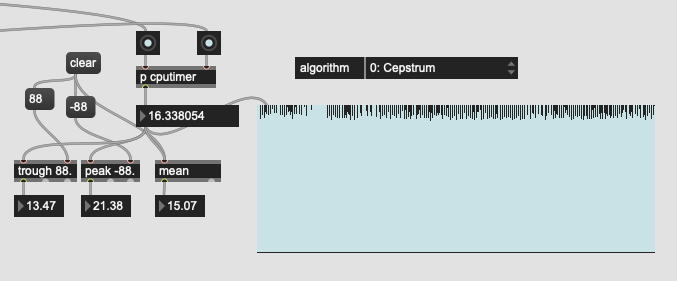
HPS:
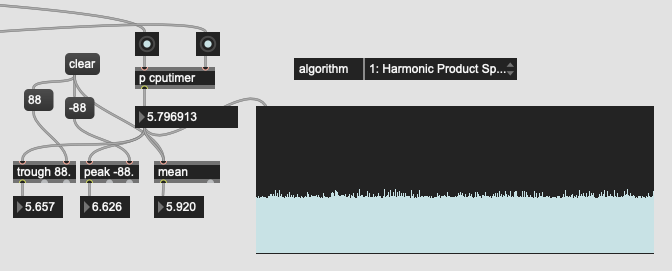
So HPS is significantly faster than the other two. Probably not as good, but for my purposes it’d probably be ok. So I plugged that back in to the overall pipeline and got this:

It’s faster, but not by much (0.2ms). Which led me to wonder if I wanted to incorporate pitch in this approach at all.
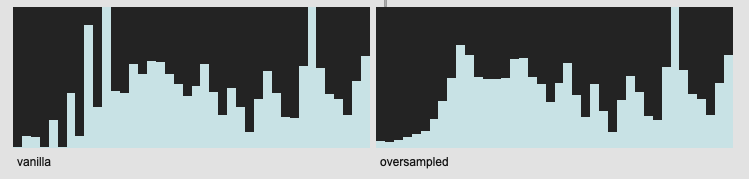
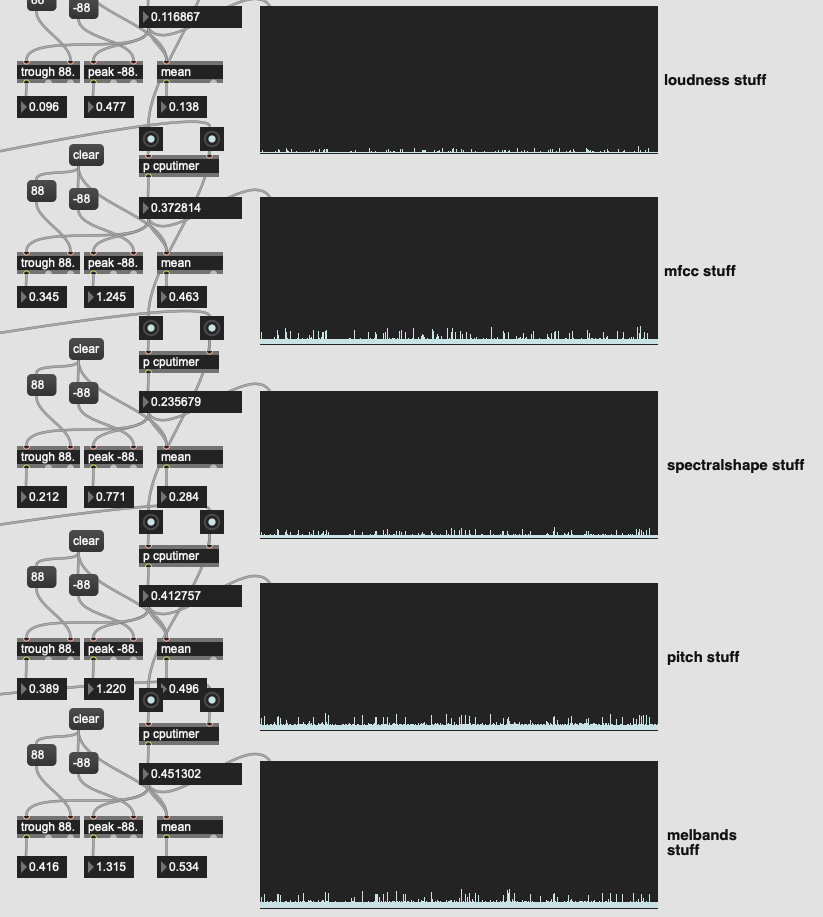
I then remembered that I was oversampling all my FFT frames based on a bug(?) or weird overlap between fft settings and analsyis frames with regards to melbands. In short, with my settings for fluid.bufmelbands~ I was getting gaps in my values lokk this:

I don’t know if it was a bug or a weird artefact or something else happening, but based on @weefuzzy’s suggestion, I started using @fftsettings 256 64 512 for my melband analysis, as well as everywhere else I was doing FFT-based analysis (spectralshape/MFCCs).
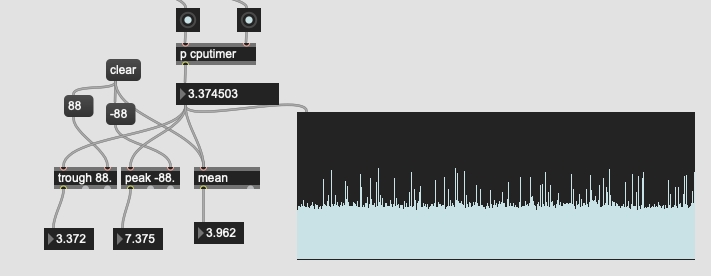
On a hunch I removed the oversampling from the pitch analysis (still on HPS) and that gave me this:
Much, much better results!
Even if I plug YIN back in (without oversampling) it’s still pretty quick:
Removing the oversampling from other FFT-based processes (MFCCs/spectralshape) didn’t seem to have a meaningful difference:
So I guess pitch is very expensive to oversample for whatever reason.
And now after all of this, the overall fluid pipeline has sped up significantly:
/////////////////////////////////////////////////////////////////////////////////////////////////////
So the first part of this post was basically me going verbose about tweaking and optimizing an analysis pipeline with a heavy focus on speed. Hopefully somewhat interesting.
Now in drilling down like this, I’ve got a couple of questions.
- Is that funky melband thing a bug in the end or just some peculiar phenomenon of the combination of settings I’m using?
- Will oversampling the FFT window benefit any of the other FFT processes at all? (spectralshape/MFCCs) This seems to have no impact on processing time, so if it helps, cool, and if it doesn’t, I’ll just remove it.
- Why is the impact of oversampling on pitch analysis such a massive increase in time? It’s 3x slower to oversample the FFT window. Is that translating to “better” performance or is there something weird happening there?
- I know YIN is “really good”, but is HPS “really bad”?
- A more technical question, are the outputs of the various pitch analysis algorithms comparable? As in, for my superfast realtime analysis, if I use HPS, but then use YIN for longer analysis windows (e.g. not comparing apples-to-apples), can I expect the confidence value to be roughly in the same range? (only asking to see if the compute that in mathematically incomparable ways). I would imagine that regardless I’d be better off using the same algorithm for the same scale of time (e.g. 256samples of HPS analysis compared to 256samples of HPS analysis) so there’s consistency at least.
- And more generally. Is there anywhere else you can see speeding things up?
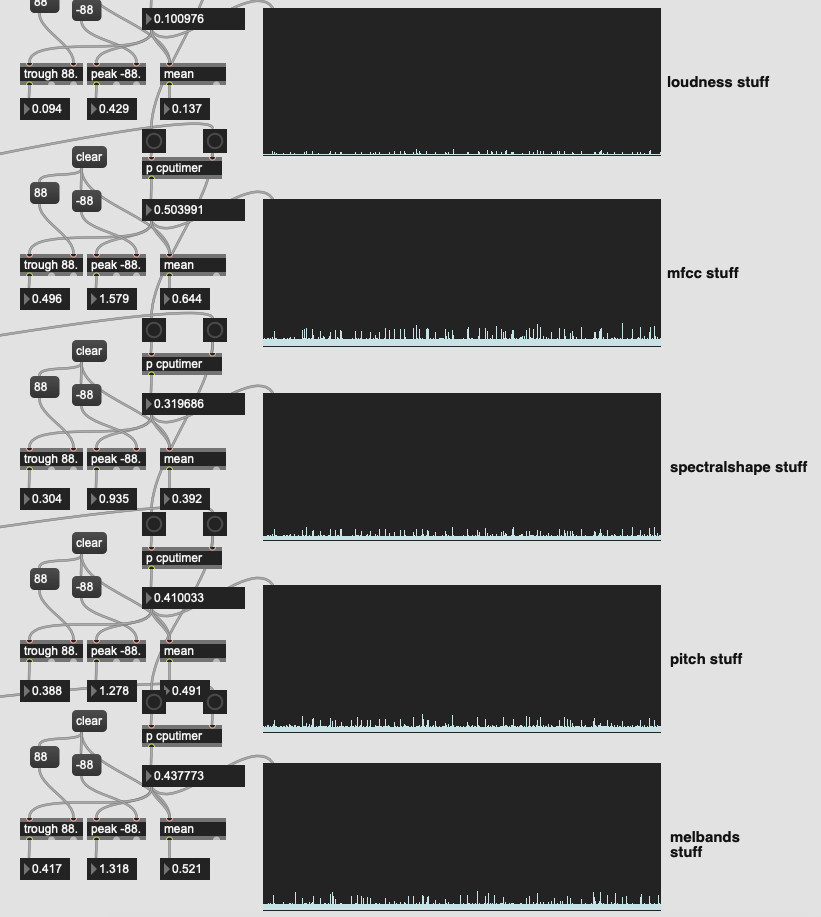
This is the descriptor/stats pipeline for all of the above:
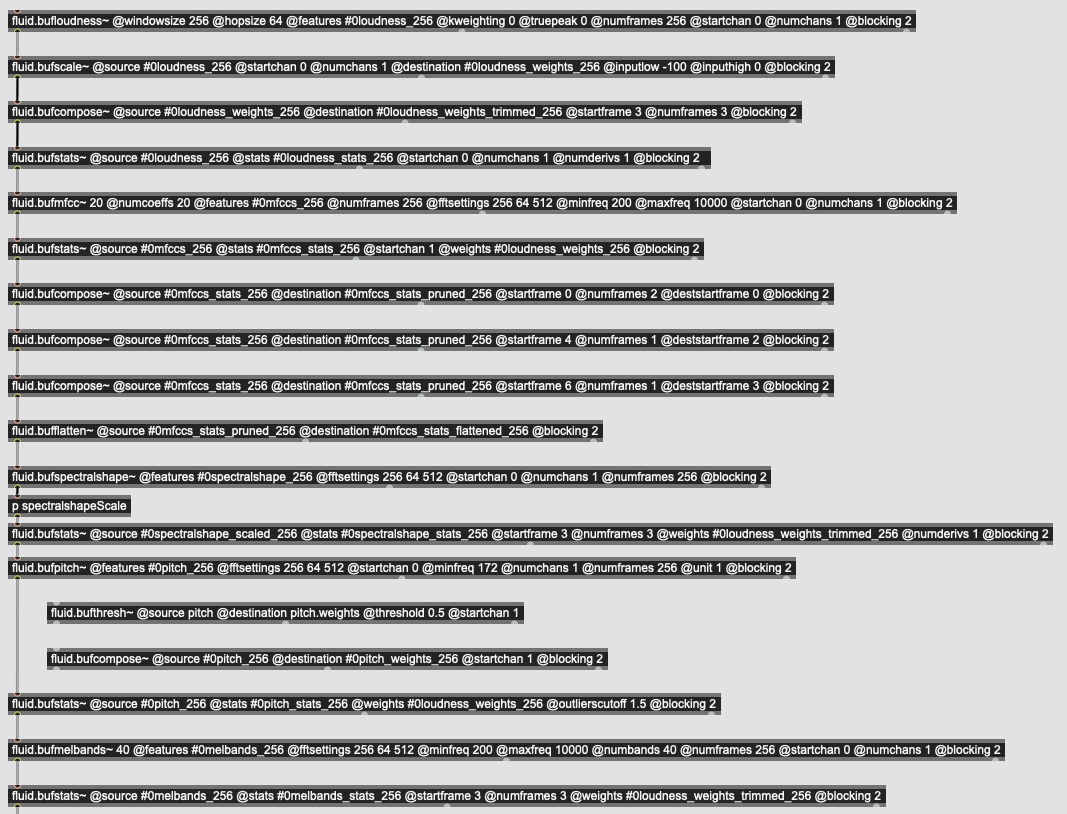
(in my previous patches I had this coded in a “parallel” manner, with a t b b b b at the top, forking off to each descriptor/stats process, but in seeing how @weefuzzy coded Example 11, I decided to go with this “serial” approach. I suppose that it all gets done in the same order anyways, but figured I’d show the code at least)