I have been working with an increasingly large dataset that I want to “knearest-scrub” around with fluid.plotter. Initially I thought that north of 10k samples in a dataset the fluid.kdtree~ performance degrades so much that, especially beyond 35-40k samples, it drags to a near halt.
I was reading this thread (though still haven’t finished reading all of it) and was thinking how I could speed up kdtree, and came up with an idea (that I’ll share in more detail in another coming post): scanning the dataset space with a kernel size and a stride and fitting a kdtree to each such kernel. As fun as it was to implement this in Max , at the end I realized that the culprit was not actually fluid.kdtree~ but rather fluid.plotter. I guess this is because jsui always uses the cpu-bound mgraphics backend, and therefore does not scale well.
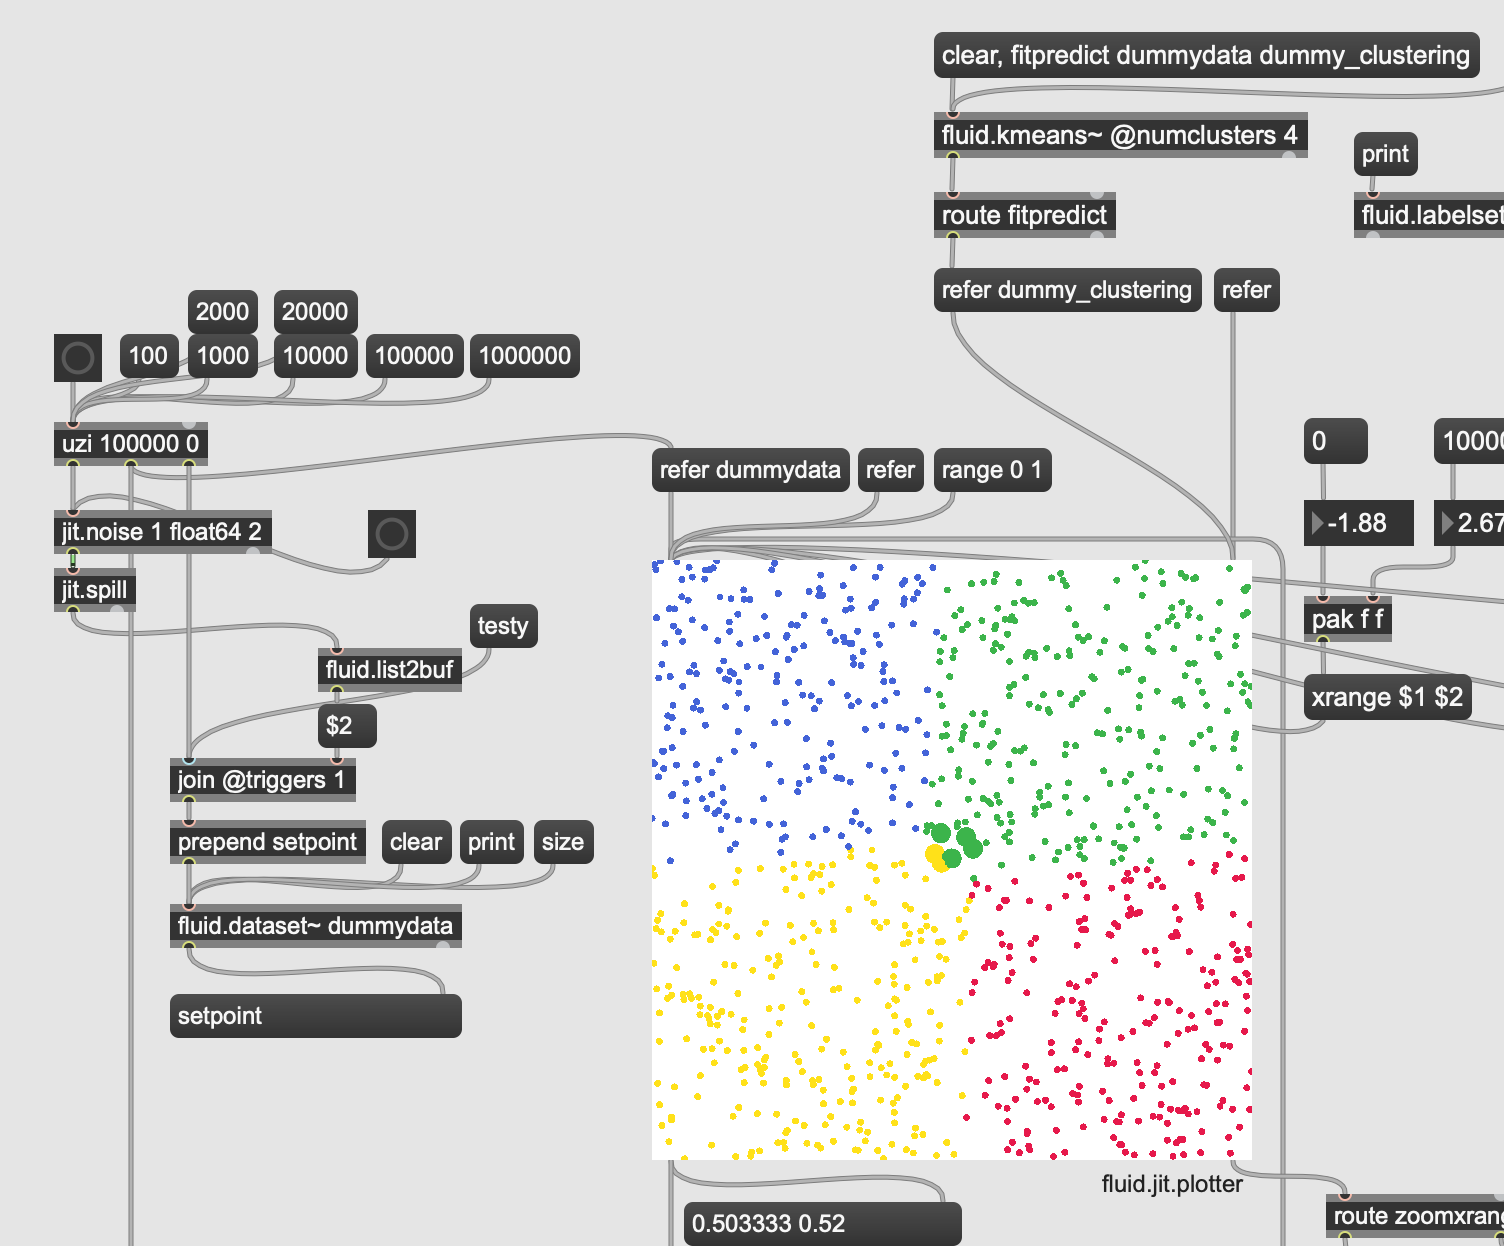
So I made a similar thing in jit.gl.land and named it fluid.jit.plotter (but still open for suggestions). It does not do nearly as much as fluid.plotter as of now, it makes the scatterplot (with fixed point size and color atm), and highlights in red. This is all I needed for now, but I can see implementing a total fluid.plotter replacement if the community is interested.
I made an example patch to show that the responsiveness of fluid.jit.plotter does not really depend on the number of points in the dataset. In the test patch there are 100k points, but I have tested with 1M too, but it’s harder to capture that since the fluid.plotter starts to break the whole patch down.
I wanted to avoid using other dependencies from my home-cooked things, so now you have to make it into a bpatcher and manually resize it to 300x300 (which is for now the hardcoded size of the thing). But if this would become part of a package then one can always use the clippings folder with a saved bpatcher instance (BEAP-style), or I can also recommend bl.autobp that can do the same.
Let me know what you think, or if you have suggestions for it, and happy patching!
Having some parity would be nice as I think I use the color/size things in places in my patches (sp.plotter mainly). I do miss that crazy 5d one we were building a couple years ago, but thankfully there’s a native way to do all that now, even if a bit slow for large datasets.
I don’t see why we shouldn’t include this in the next release at some point, even as a release on its own. I could help facilitate that @balintlaczko if you were open to it? I think as @rodrigo.constanzo pointed out some additional finessing to make it more in line with the existing non-GPU one would be all it needs.
Assuming the drawing is exactly the same and has all of the same features (highlighting, zooming features) there is still the ergonomics of the resize and whether or not people want to have jitter in their patch. I think that the js version is longstanding enough at this point that a replacement poses risk in modifiying the behaviour of what is there, without serious testing, which as we know sucks in Max.
Hey all, I am getting close to ready with this, it mostly mirrors the interface of fluid.plotter but there are a few differences.
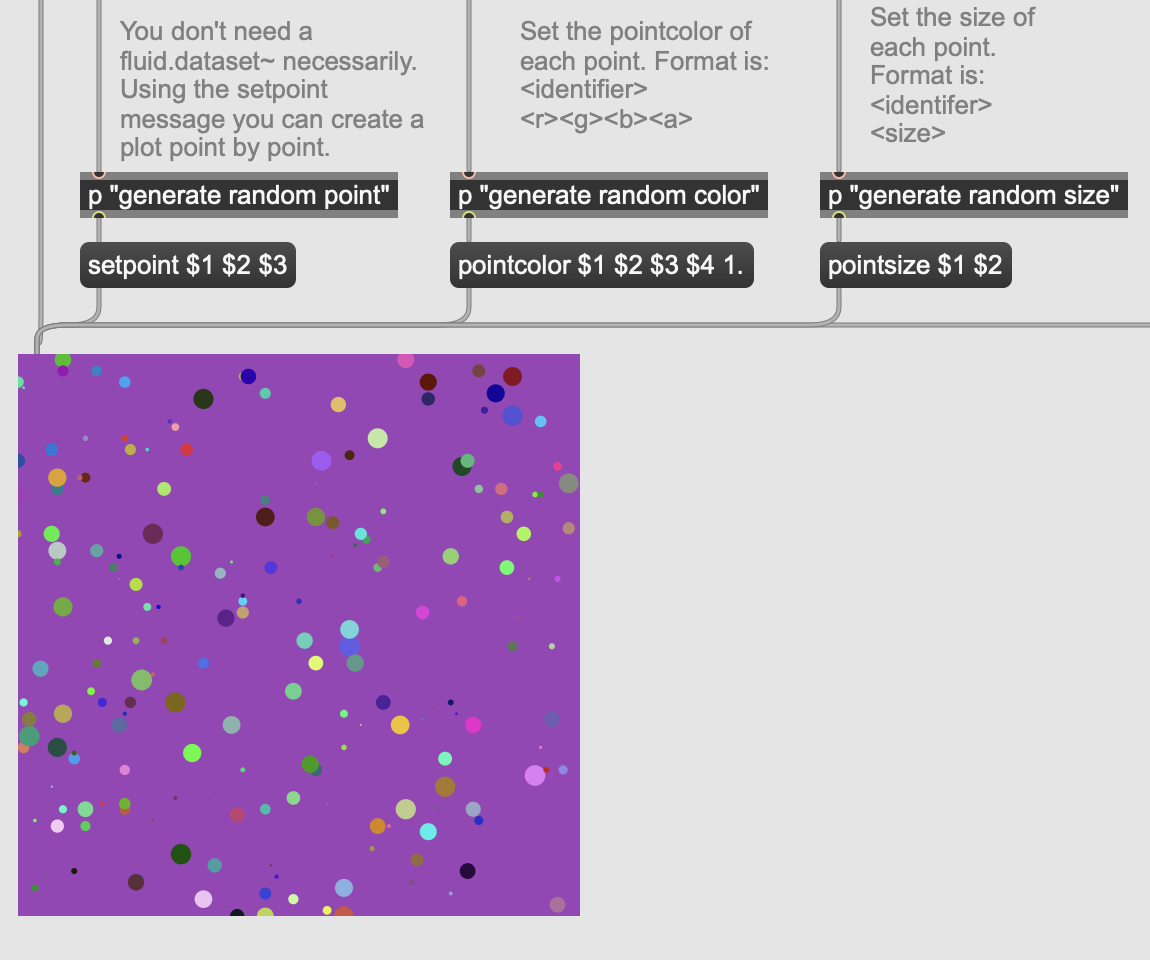
First, individual setpoint, pointcolor and pointsize are not implemented:
I can look into this if there is a huge public backlash for not having them, but since the aim of this abstraction is to have a high-performant variant of fluid.plotter (that can take 1M points without much “scrubbing” lag), I decided not to have them.
More importantly, to populate the plot you need the refer message with a dataset name. This avoids some unnecessary copying that can be a big time-saver with large datasets. The right-side labelset inlet also listens to refer, although it understands dictionary too since (sadly) it’s anyway using dictionary dumping under the hood (unlike the dataset). I’m thinking of how to improve this in a future update, but it might be good to already get used to using refer.
Both in the case of the dataset (left inlet) and the labelset (right inlet) a refer without arguments clears the reference and the plot/colors.
The rest aims to have parity with fluid.plotter, so we have:
highlight that works with lists (and non-numeric IDs)
xrange, yrange, and range
shape (“circle” or “square”)
pointsize and highlightedpointsize (both are ints – this is actually not in parity, they are there instead of having one pointsizescale and a fixed size-ratio)
bgcolor
click’n’drag zooming and reporting zoomxrange and zoomyrange via the 2nd outlet
…and of course now it can be resized and it enforces (somewhat jankily) a square aspect ratio on the bpatcher
Here is a w-i-p test patch while there is no help patch yet:
I think pressure testing this could be of good help. Also, I’m not certain where we can sensibly package it for maximum impact. I’m thinking of a tab in the fluid.plotter helpfile…
Unless it doesn’t have (all the) main feature parity, I would opt for a complete replacement. There’s already so much “lore” that’s missing for new users as things are buried in forum posts, example folders, 3rd/4th tabs of help files, it would be a shame to add new stuff but put it out of sight.
edit: I do like having the individually addressable point size/color like the 5d one from a while back, but I’m presently not using anything like that.
Is this due to the per-point set approach to this (instead of older approach that had color/size as separate pre-packaged matrixes?). I personally liked/preferred having/building a separate matrix per D anyways, rather than having to uzi/iterate through a long list to manually set each individual point (as is the current paradigm/implementation).
edit edit:
Being able to do this with a native plotter would be amazing.
it doesn’t and won’t, so let’s not dwell. Also, since it makes a diff only at 100k point+ then it is quite a niche use… or at least probably not a beginner
Even with a modest (few hundred) amount of points I get lag when it first using it. It “catches up” after a bit.
That whole thread was essentially that, but it was never folded in (hence the comment about things lost in the forum, of shoved in a folder). Things not baked into the actual files don’t really get used or explored. But that’s a tangent not relevant to the thread!
I can look at the 3D version in a bit, I do think it would be cool, too! Maybe as a fluid.jit.3dplotter…?
As for the individual point sizes/colors, it is of course, possible, but since fluid.jit.plotter was aimed for speed with large datasets, I sacrificed these features in the name of speed. If we want the individual settings we have to change paradigm (instancing via jit.gl.multiple instead of using jit.gl.mesh), and that adds quite the overhead when we talk about 100k+ objects.
…and those features are already covered anyway in fluid.plotter, at the moment I see novelty in making a solution for a lot larger datasets (like fluid.jit.plotter) or making the 3D one.
I feel quite strongly that having this as a separate object with its own documentation and help file is the best path forward. It is a tool that is called for in different circumstances, and is there to overcome the limitations of Max and the wider problem of high dimensional visualisation. It also shows a significant benefit at high numbers of points but it does feel quite a lot faster even at low dimensions. In many ways its a superior option for simple uses cases, especially if the plotter is being used instrumentally.
I just didn’t want it to end up in an abandoned /Examples folder never to be seen again. Having it as a “native” abstraction, folded into the actual documentation would be fantastic.
it won’t replace the canonical one in the helpfiles for many reasons, but a tab pointing at it in the canonical help to showcase the main raison d’être, and its own help, seems a better place than Examples indeed