Indeed, those are plugged into the jit.gl.mesh-es as the point_size attribute, and they are int only.
Exactly!
That is actually normal (I think), if highlightedpointsize == pointsize then you are essentially not highighting (or doing an expensive nothing op).
I am still not 100% given up on fixing the low-res points, but my hunch is that it might be related to why fluid.jit.plotter is so fast. Having higher-res points (circles) might slow it down – or might not, I am not sure now.
The low-res points thing is a big ugly but at least functional. The highlightpointsize is a bigger problem as if both points = 1, then nothing is highlighted, if pointsize = 1 and highlightpointsize = 2 then you have this gigantic highlight like in the screenshot above, effectively making highlighting impossible.
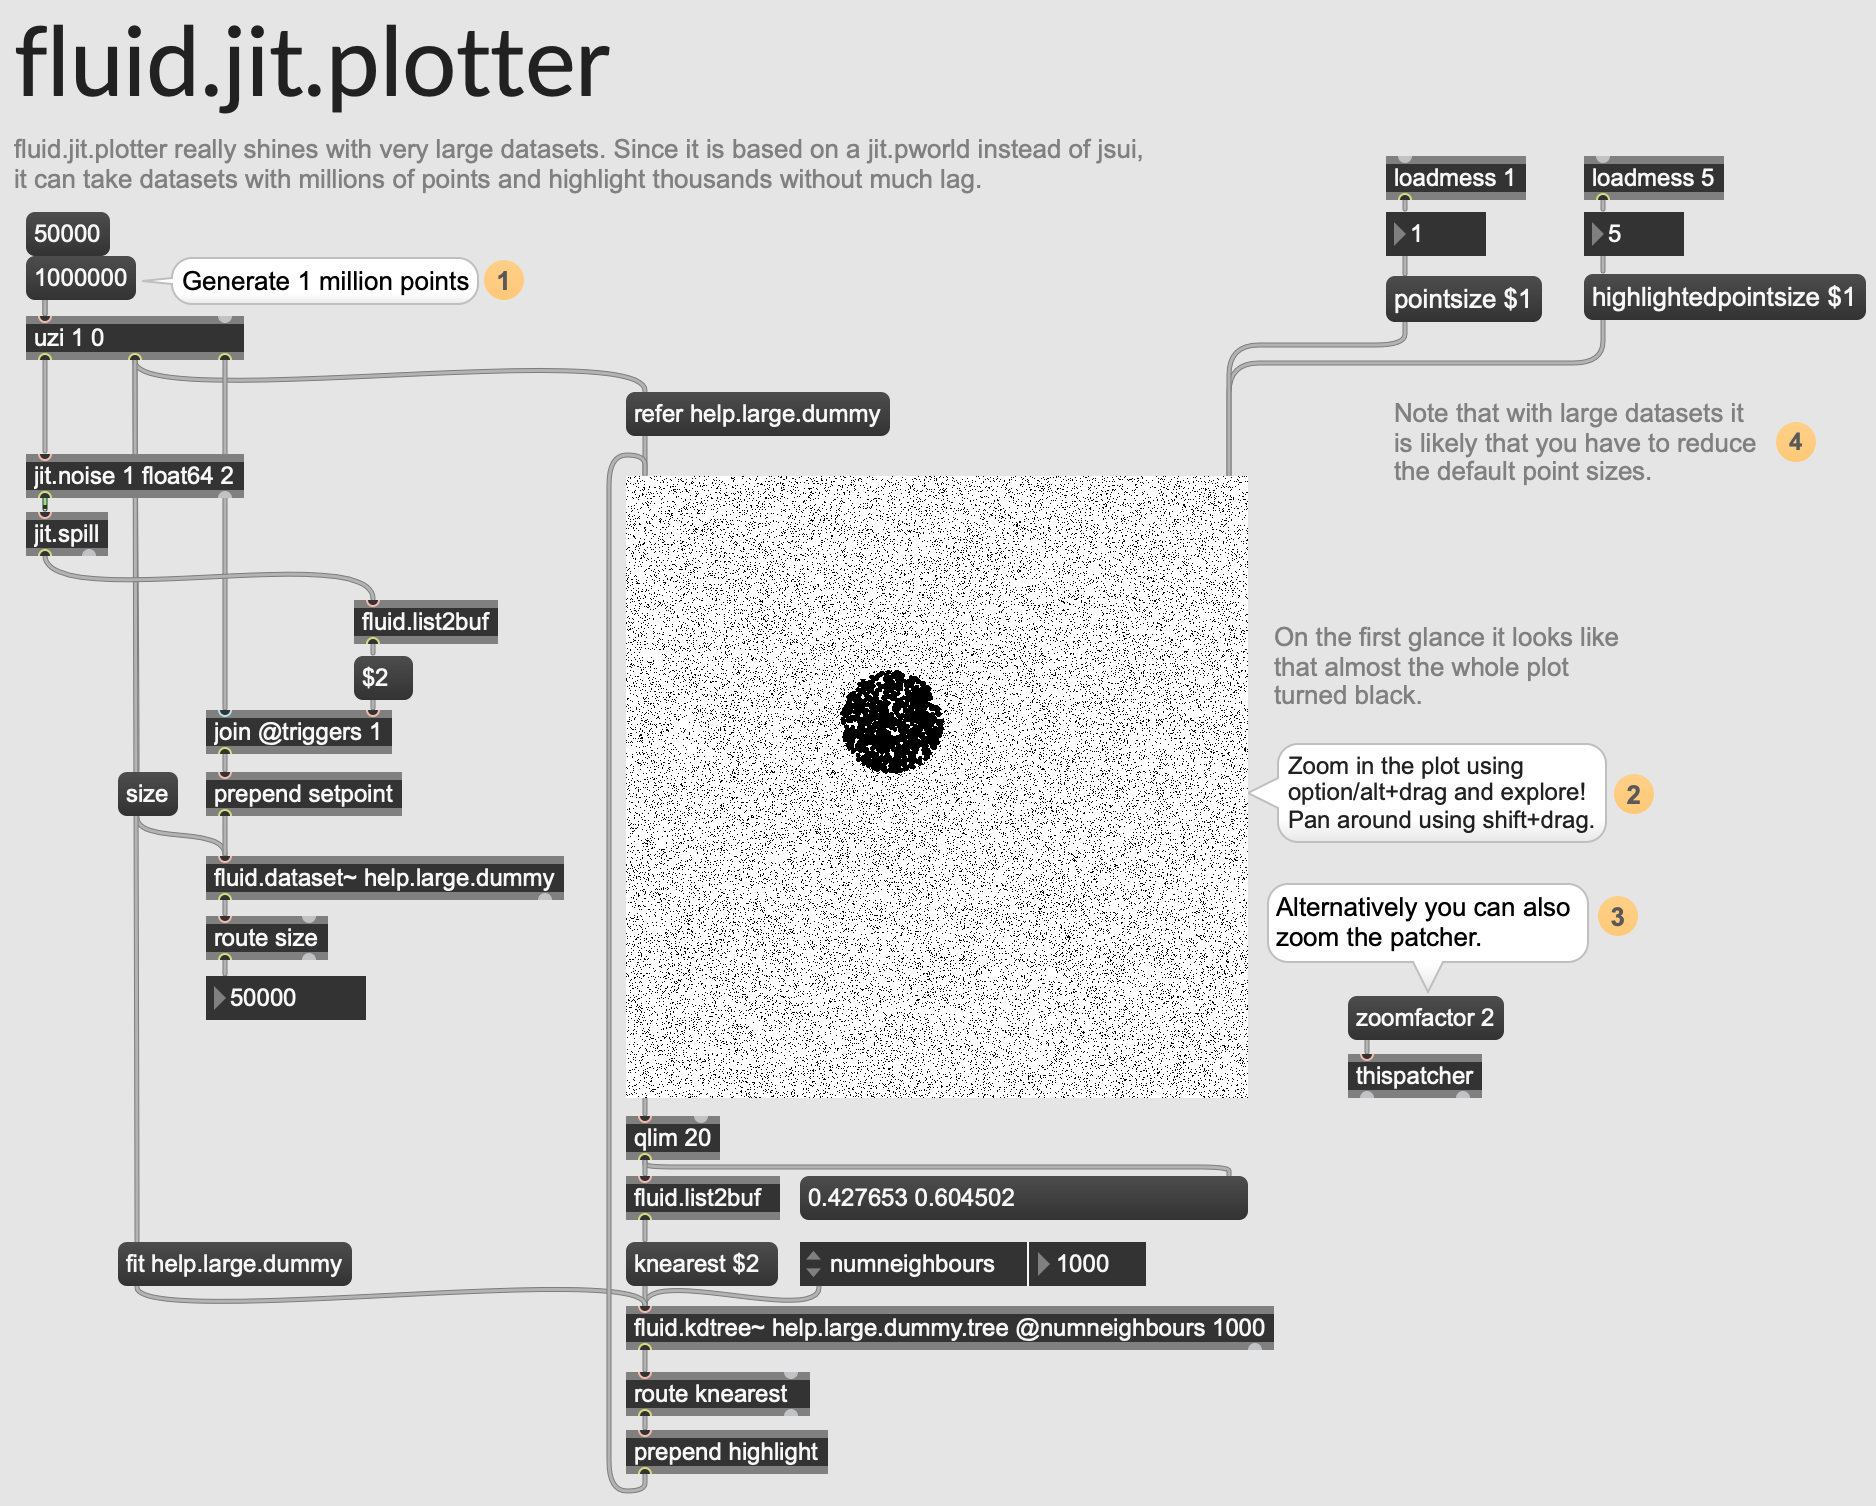
Just checking, but could it be that you are unaware that you are highlighting a 1000 points on the screenshot above? Look at the kdtree @numneighbours 1000 below the plotter. All of them have a point size of 2, but together they form a large “mega-point”.
1 Like
Hah, I had not! That makes a lot more sense, hehe.
Still is a bit restricted with the integer scaling as it seems like that any size at which the jitter version would be beneficial (e.g. >10k), it’s not possible to view all the points at the same time anyways.
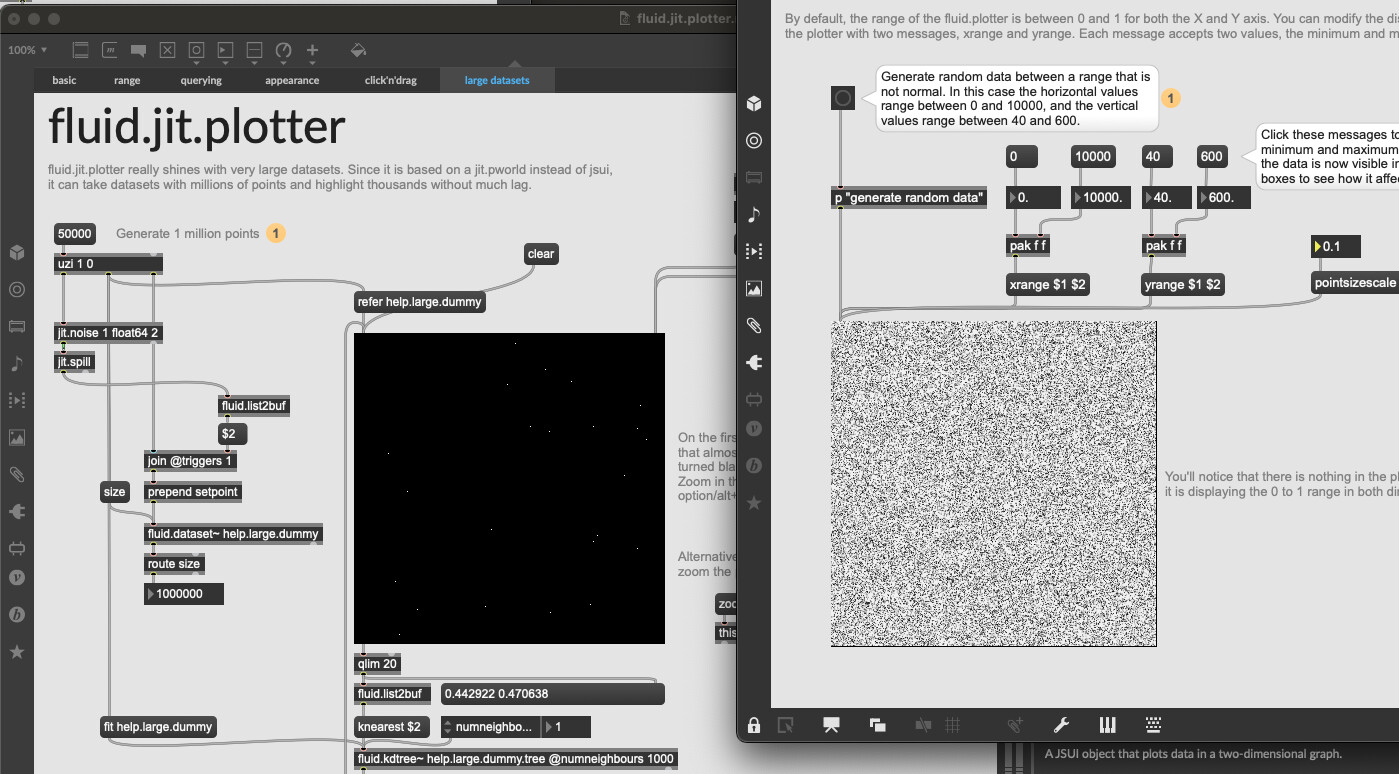
Here’s 50k points at the minimum size on fluid.jit.plotter and at pointsizescale 0.1 in fluid.plotter:
Where I ran into issues above (wanting to plot 50k points) is wanting to scroll on a 2d grid to pull up samples from a large corpus, so want to be able to have “all” the points on display the same time, to navigate the space.
For me it looks okay with 50k points:
Not sure what’s wrong, but one guess is that the point size does not get properly initialized? Can you try setting pointsize once more after you have loaded the 50k points?
Or could this again be down to the non-retina screen issue with jit.gl.mesh?
I definitely set/checked it a few times, even moving to 2 in which it goes completely black…
Just checked it on my (retina) laptop and it looks like yours:
It seems like it’s this again. The weird thing is my monitor is 4k, so plenty of pixels there to display.
1 Like
Thanks for confirming this, I experienced the same weirdness. I think there might be a bug somewhere in the plotter. I noticed that the point sizes can jump a lot when moving the host patch to a different screen. But now I tried to recreate the issue with just a few jit.gl.mesh-es and even instanced gridshape-s just to compare the point drawing quality (seems to be no difference) and the point sizes are comparable on both screens while the weird scaling problem is absent.
This makes me think it is either something with the plotter itself or jit.pworld. Have to investigate more.
1 Like
OK, now I could reproduce the problem stripped down, it is jit.gl.mesh, and it produces the same problem both with jit.world and jit.pworld. It has something to do with the @ortho 2 orthographic projection (though not sure). I’ll make a bug-report.
1 Like
Ah very nice!
Good to know it’s a narrow-down-able thing as it seemed quite tricky to figure out exactly what/why.
Yes, well it is still a bit mysterious, but I did what I could and sent them a bug report, hopefully it will be fixed soon!
1 Like
Hello, there seems to be a bug with the resizing of fluid.jit.plotter:
switching to presentation mode and back, the fluid.jit.plotter resizes correctly when going to presentation mode but stays in this size when going back.
Also, it would be nice if the fluid.jit.plotter could use the alpha channel for the bgcolor, so that the background can become transparent with “bgcolor 0. 0. 0. 0.”, now the alpha channel is ignored and the backround is always opaque.
i hope i have the latest version installed and that these bugs are not allready fixed, if so, i’m sorry and would like to know where i can download the last version :).
2 Likes
Thanks, and yes, I am aware of the presentation mode problem, and will fix it soon! 
Adding transparency to the background is a great idea, I’ll look into that too!
3 Likes
Did you ever hear back from c74 re: the bug?
I was excited to check the release version of fluid.jit.plotter but it still renders all huge(/useless) on my desktop monitor.
Hopefully that’s something they address at some point as there’s a few things that just don’t play nice on big monitors (I imagine they don’t do much 4k testing/using while developing).
Hey all, finally got to submit a PR here, that fixes the coupled presentation mode issue (reported by @axelkolb), and adds individual point coloring in parity with fluid.plotter, so now every point can have a unique color (@rodrigo.constanzo might like this).
Tried to make that happen, but sadly that’s a limitation of jit.pworld (or rather, jit.gl.render) since it cannot use alpha for its @erase_color.
Sadly not, I suspect that since it only occurs with certain monitor models and not all of them, they might think it’s a low priority issue. In my experience it is still usable though, I just have to nudge the point sizes a bit when moving between monitors. But hopefully they fix the issue at some point, we gave them the most precise report ever.
3 Likes
Ooh, point color thing is great!
Is this something that is solvable programmatically? I know 4k is involved, but is there some (unknown to Max) thing about PPI or something that triggers the “huge dots”?
Not sure tbh…
But HUGE news, I marked the PR as a draft, and almost finished implementing setpoint aaaaand individual pointsize! This means I’ll able to have 100% parity and interface match with fluid.plotter while keeping the speed boost. Yaaaay.
2 Likes
Exciting!
I guess with this bit I meant if it’s possible to query monitor size in Max in a way where having to…
… becomes baked into an abstraction and not something a user has to do. (Thinking specifically of SP-Tools here obviously)
Oh I see! I haven’t thought about this, but the problem is that the extent of the bug is not just different point sizes, but also — and for me this typically happens when I move things back to the MBP screen — that the whole scale of the pointcloud changes, as if you zoomed in with range 0 0.25 or something (assuming you started at range 0 1), and that is irreversible until you delete that object.
But I’ll take note of this now and try some experiments. The other problem is that we cannot know the physical size of the monitor, only its resolution, so we cannot calculate/estimate the PPI. (or can we?)
The best would be if C74 would fix the bug, but I sense that it is not dire enough for them to spend time on.
1 Like
Ah gotcha.
Yeah I can see moving between monitors being really problematic in that sense. Thankfully for my use case(s), it’s just single fixed monitors. Sometimes I’m on my laptop, and sometimes I’m on my desktop.
So it’s more a matter of trying to code around the bug in a way that makes fluid.jit.plotter a usable replacement in SP-Tools (also enabling huge dataset navigation!). I don’t really (fully) understand the semantics of what causes the bug to manifest or not as it seems to work fine on some 4k monitors(?).
1 Like
By the way, would anyone be interested in shape selection (“circle” or “square”) per point? I am working on the individual point sizes, and realized that since now all the drawing will be controlled by our shader, we could as well specify a variable for shape that is a matrix. For getting to parity with fluid.plotter I already have to put an if branch in the shader to draw circles or squares, but since this is on the gpu, instead of a uniform float type variable this could also be just a float, which would reference another jit.matrix (where, let’s say, non-zero values would correspond to a square shape). This could also leave room to add more shapes in the future.
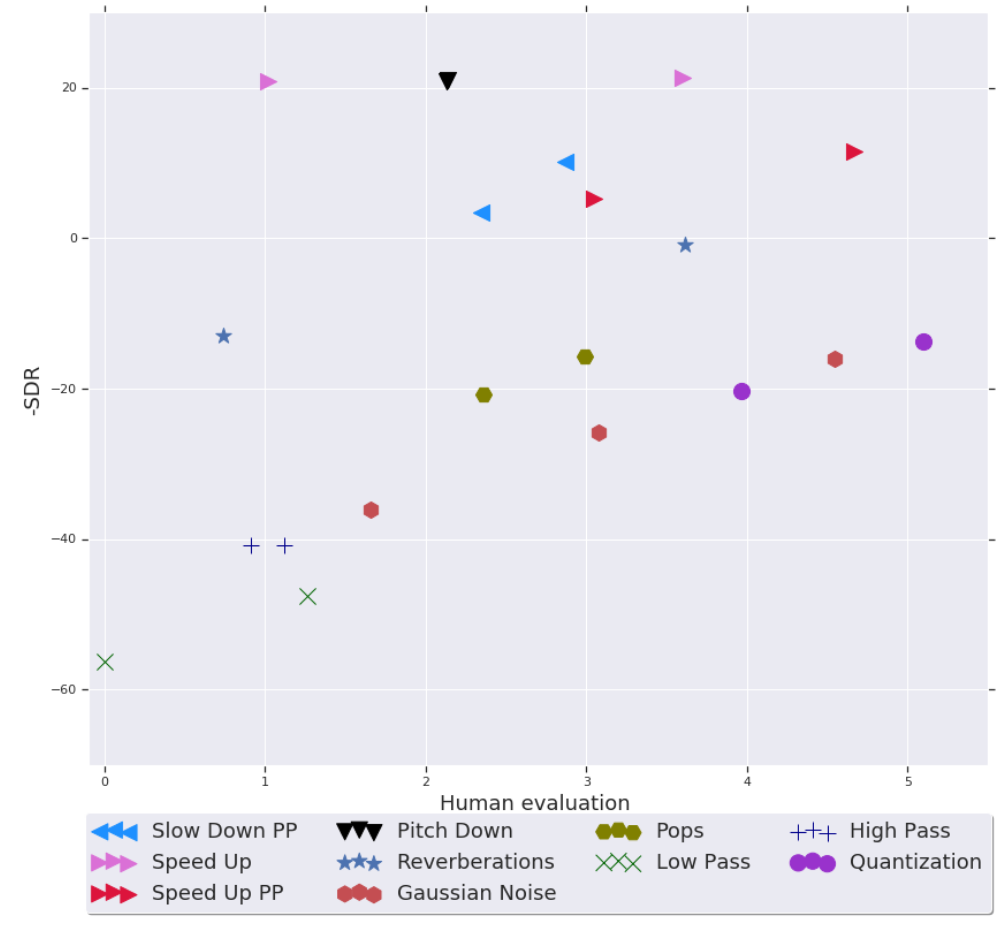
But this would damage parity, since now we would need a message like shape <identifier> <shape-enum> instead of shape <shape-enum> as currently in fluid.plotter. But being able to distinguish a set of points by shape might be a valuable feature to make plots like this one:
Any opinions?
1 Like