Class "interpolation" (distance to classes)

So something I’ve been trying to do for a while is be able to train specific classes and then when feeding it new audio, be able to not only retrieve the nearest class, but to also to get the distance to that class. Or rather, whether it is more one class than the other.

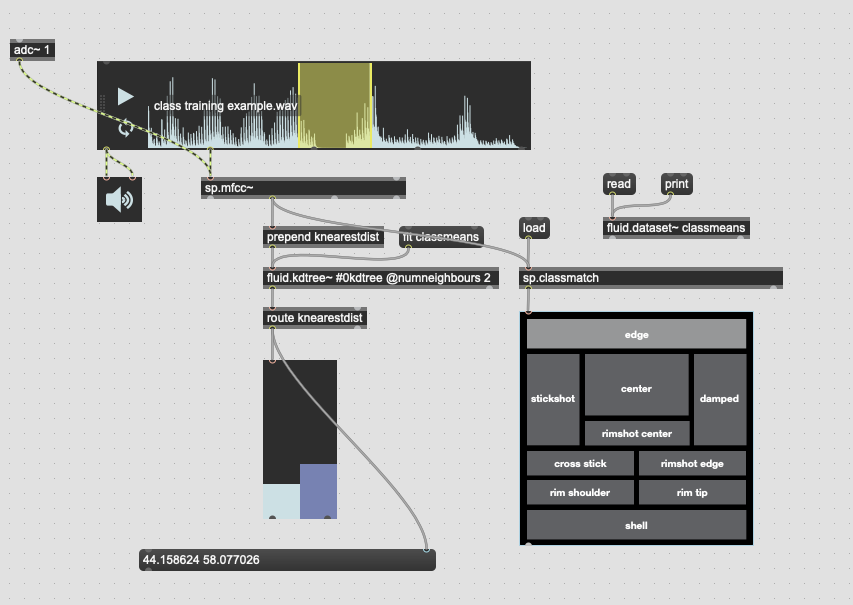
The first part of that is well sorted now, and I’ve even improved it recently moving over to fluid.mlpclassifier from fluid.knnclassifier, but at its core its using a 104d (12 MFCCs + stats) space to use to feed the classifier(s).

The second part of that has confused me so it’s been on the back burner until recently. After having a very useful chat with @jamesbradbury I realized the missing part of the puzzle was putting things back into a KDTree and using knearestdist to find out the distance to the points, but I’m still not entirely sure how to go about this.

/////////////////////////////////////////////////////////////////////////////////////////////////////////////////////////

Firstly, some context.

The intended use case here is to be able to train two points like “center of the drum” and “edge of the drum” and then by knowing the distance to each class, be able to approximate the position I’m striking the drum. Similar to this:

Screenshot 2023-05-07 at 12.16.09 PM

(you can hear the example about halfway down this page)

There are obviously loads more interesting applications of this, but this is my starting point as it involves just training two classes, and getting a single value that represents how close it is to one or the other.

/////////////////////////////////////////////////////////////////////////////////////////////////////////////////////////

Now back to the problem(s)/confusion.

In looking at the fluid.kmeans~ helpfile, it looks like getmeans would be my first port of call in order to get the means of each manually labelled class but it looks like getmeans only works if you ask fluid.kmeans to create clusters for you. If you have manually created these classes, it doesn’t look like there’s a way to compute the means?

So the first problem is generating the means of each class in the first place.

Is there not a native way to do this? Would I have to dump the contents of each dataset, group them into their respective classes, then either chuck rotated versions into fluid.bufcompose~ or just doing the maths in Max-land? And for that, is it a matter of literally getting the mean of each column? (i.e. the mean of every instance of the 1st coefficient for classA would represent the mean of that point) So the end result for this process would be two entries of 104d each, with each of those ds being the mean of their respective columns?

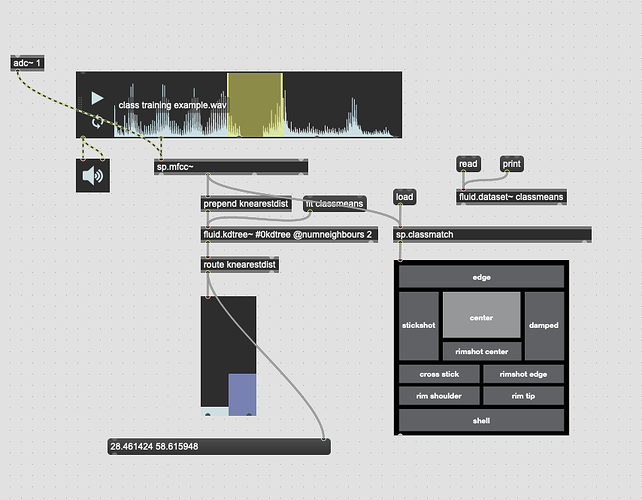
The second problem is once the above is solved, presumably the next step is creating a KDTree with two entries, classA and classB. I would then give it new points and with a combination of knearest and knearestdist know which “class” I’m nearest, and the distance to it.

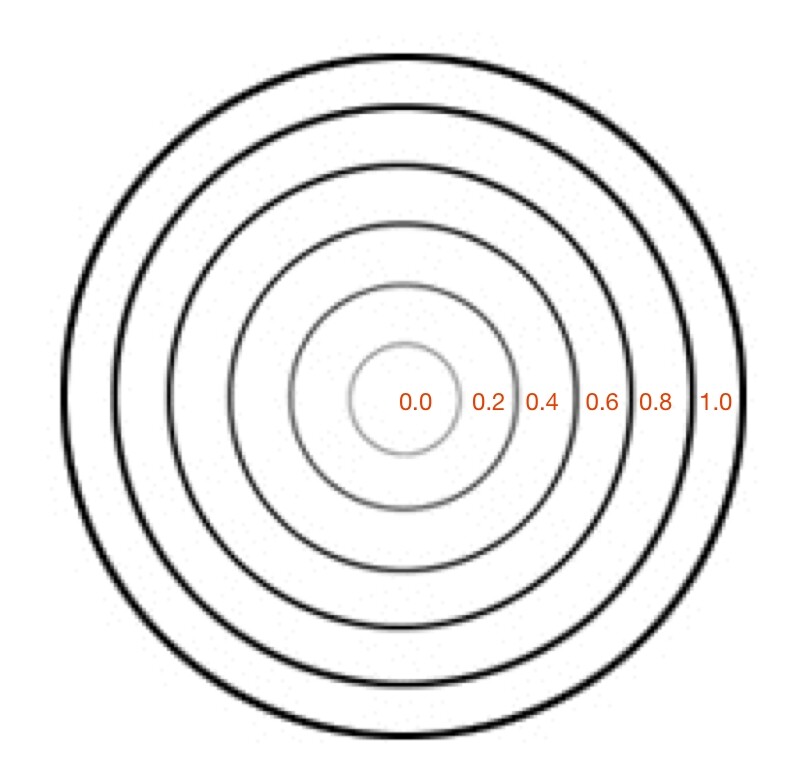
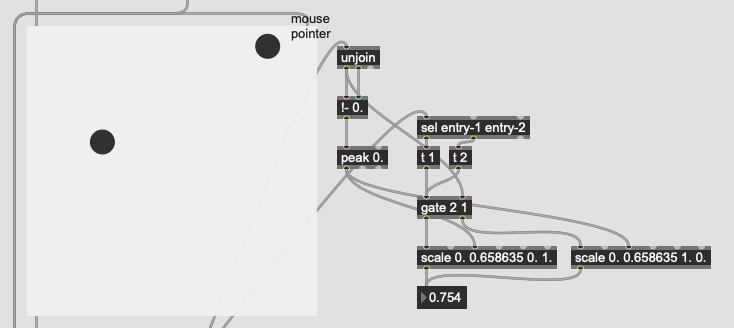
The problem I’m not getting here is that I’m not actually interested in the distance from the point I’ve matched, I want to know how much more the input is like one class or the other. So in poking around the fluid.kdtree~ help file, if I make a fake dataset with two points and set @numneighbours 2 (so I get the distance to/from both) I get something like this (with fake “mouse pointer” for the sake of legibility):
Screenshot 2023-05-07 at 12.49.04 PM

Screenshot 2023-05-07 at 12.49.13 PM

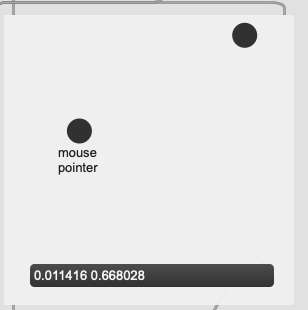
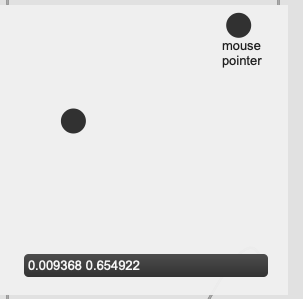
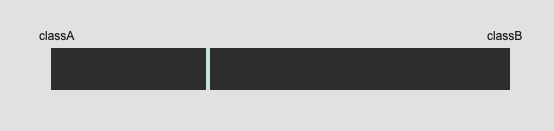
Now after a bit of logic/scaling, I can create a float where 0. = classA and 1. = classB:

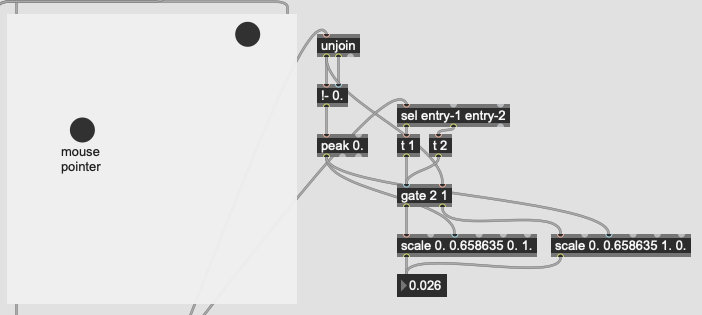
I have to figure out the maximum distance between the points first, then scale accordingly.

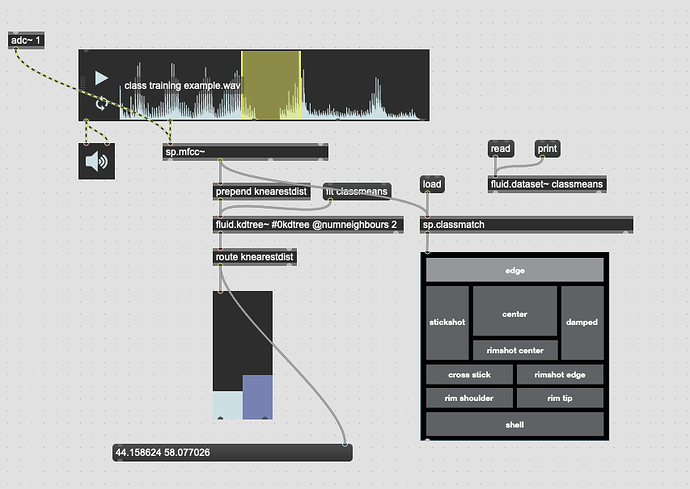
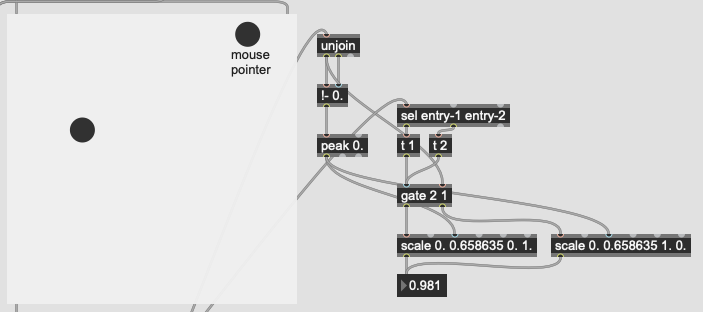
This works great… if I only move between the points. If I’m anywhere not directly on that line between them, this math/scaling doesn’t work. And also freaks out if I’m “past” the points:

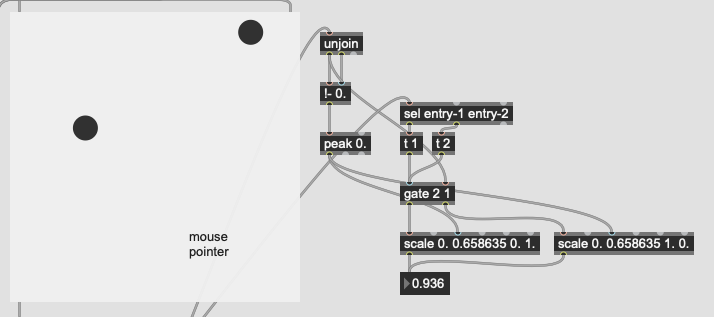
There’s probably some maths here I’m overlooking to fuse/combine these numbers to get the nearest class, but in an example like this:

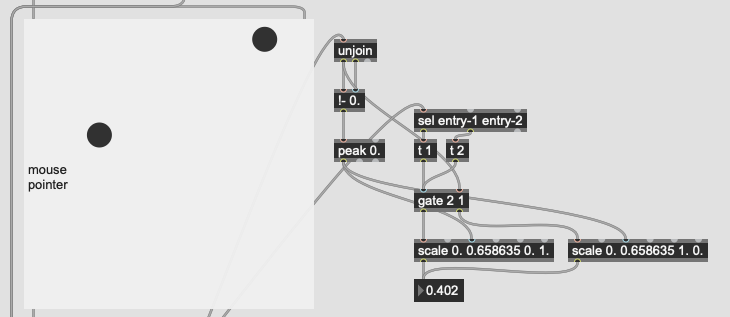
I would want the answer to be 100% classA (so 0. given the scaling above), since even though it is not directly on top of classA, it is much closer to it than it is to classB.

I imagine it will be something like scaling both numbers by some factor then summing them, but for the life of me I can’t think or picture what or how that would work.

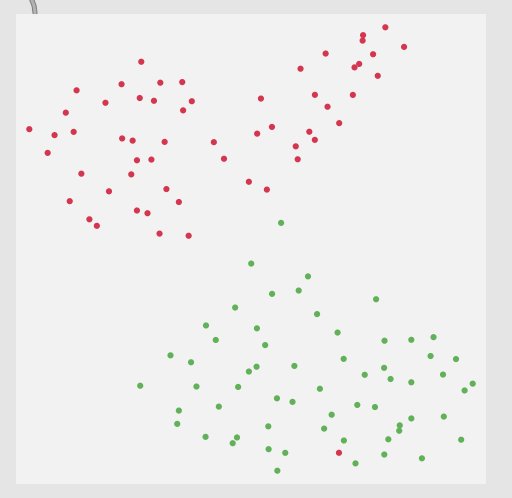
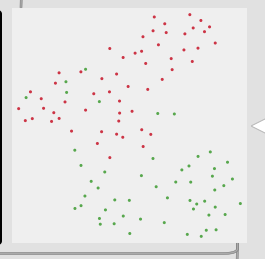
Thirdly, although this is not a full-blown problem in-and-of itself, my actual data will be 104d, so it won’t really be possible to poke/investigate it in the same way as this 2d XY example.

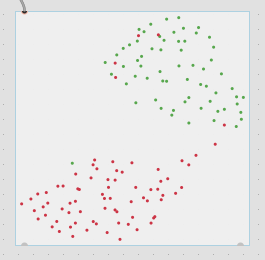
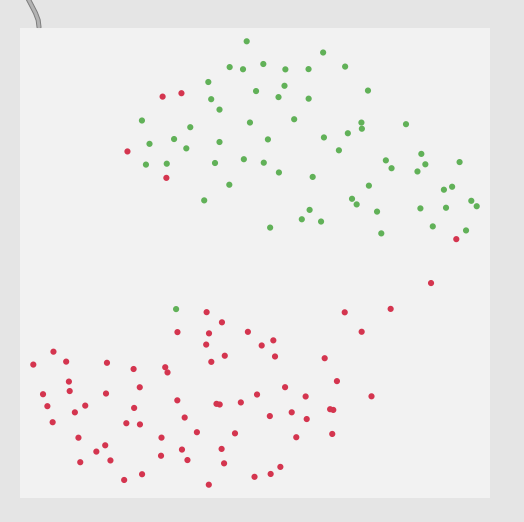
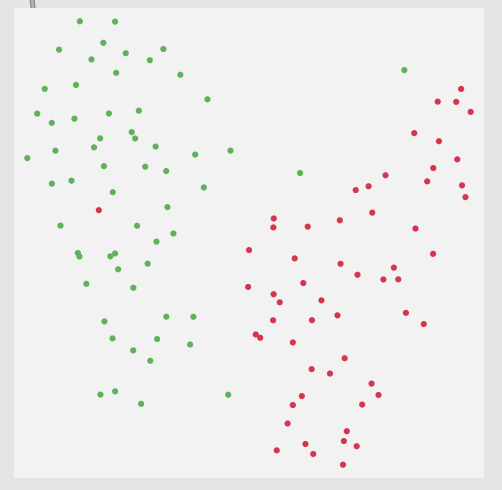
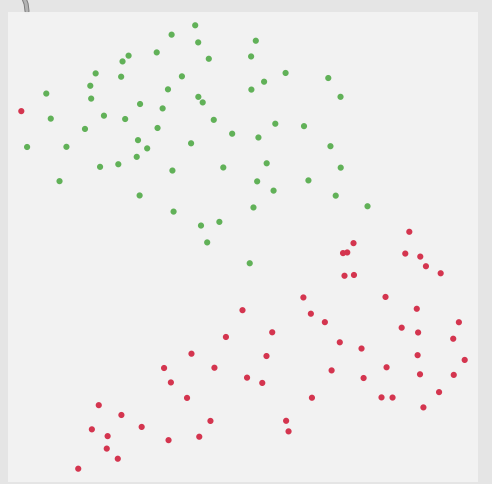
Here is a 2d flattening (UMAP) of the type of spread/data I’m going to be actually working with:
Screenshot 2023-05-07 at 12.05.18 PM

/////////////////////////////////////////////////////////////////////////////////////////////////////////////////////////

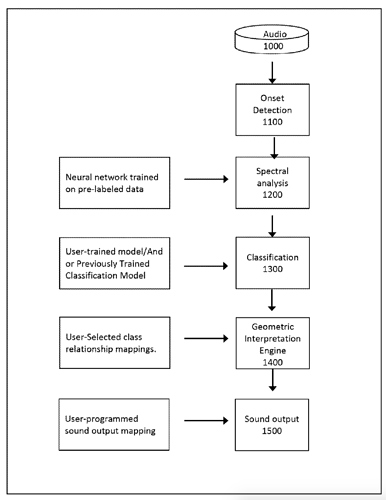
So I guess the initial thing I’m unsure about is if I have the general workflow correct here:

  1. Create two classes uses fluid.knnclassifier~ with 104d input data.
  2. Generate the means for each of these two classes…“somehow”.
  3. Create a two entry KDTree with the means of each class as a point.
  4. Get the knearestdist of those two points and do some maths to get a float of where on the spectrum between classA and classB the results of knearest inputs are.

Is that about right?

If so,

  • is there a sensible/native way to do step 2 (short of dumping/sorting/mathing each point in Max-land)?
  • what would the maths be for step 4 that still takes into consideration the proximity to both points and returns the nearest point while taking into consideration the further one

there is. kmeans dump has that for you as you said but you could probably enter your own class in there and “train” for one iteration and it will optimise the centroids. It is worth a try.

that is literally what knnclassifier is doing. so the best way forward for you I think is not your proposed workflow but this one:

once you get you centroids, compute the distances in max… or ask kdtree for the knearestdistance, which again is doing the work for you. but I am not certain I understand what you want for real in the whole process…

===
if you want a value of distance for each k nearest points, from a class centroid, to have a single value to decide between 2 bespoke classes, then there are other ways. out of context it is a bit harder - but if you train a NN on the 2 classes, you can also use a regressor with 1-hot encoding… or dump the classifier output and load that in a regressor and you’ll get 1D per class as output: the centerness and the edgeness. that might be interesting to get more nuanced, and including how confident it is (1:99 vs 49:51)

this is again not far from what Alex wanted in his piece (get the value of each class)

I hope this makes sense? In other words, there are many ways to get there, all different, depending on how you want to use them. The famous ‘It Depends™’ is back :slight_smile:

1 Like

In case it wasn’t clear, this is what I refer to:

1 Like

I’ll start with clarifying my intention/desire as the whole kmeans/kdtree/knearestdist/etc… is me just trying to make my way to that. I don’t have a specific interest in computing means etc…

The most standard use case here would be would be to train ~50 hits on the center of the drum, and label that as classA, and then train ~50 hits near the edge of the drum, and label that as classB. I’ve got this part working well and fairly refined.

Now what I want to do is hit the drum anywhere and have it, effectively, give me the “radius” from the center where I’ve hit the drum by telling me whether I’m closer to classA or classB. In a really simplistic way, something like this:

So in this case hitting dead center on the drum would tell me that the hit was 100% classA and report a value for that (0.0 in this case), and if I hit near the edge, it would be 100% classB and it would return 1.0.

Or something along the lines of this, with a single value reporting where on the spectrum between classA or classB a new sound is:
Screenshot 2023-05-07 at 5.14.04 PM

This is what I would like to do, as a core use case.

/////////////////////////////////////////////////////////////////////////////////////////////////////////////////////////

I initially thought I could do this directly in the classifier, as it has a KDTree, and is computing distances etc… so if there’s a way to skip all the kmeans/means/kdtree stuff, I’m all for it!

For the life of me, however, I couldn’t figure out how to do that.

(having a quick look through @jacob.hart’s article on @a.harker’s piece, and it looks like @a.harker made a build of the object that spits out the “hotness” of each of the classes, so I guess the native/vanilla build does not do that (it would be useful as it looks like exactly what I’m looking for here!))

/////////////////////////////////////////////////////////////////////////////////////////////////////////////////////////

Not sure I’m following this part.

In my case I know exactly what the classes should be, so I wouldn’t want fluid.kmeans~ to mess with that at all. I have 50 hits of classA and 50 hits of classB, which I label/train up in fluid.knnclassifer~ (and fluid.mlpclassifier~).

Hmm, I think this may do the trick here. Would this also work with fluid.knnclassifier~ + fluid.knnregressor~? At the moment I’m training a knn classifier as the default since it’s a single-click operation and works “fine”, with the MLP one being optional.

edit:
It does not seem to do the trick. Or if it does, I can’t figure out what level of dump to send fluid.knnregressor~ from fluid.knnclassifier~ without it returning an invalid JSON format error.

/////////////////////////////////////////////////////////////////////////////////////////////////////////////////////////

I imagine this shit has long since sailed, but out of curiosity, why don’t the classifiers spit out this info? I always assumed they did, and I hadn’t really gotten around to making use of it yet. And I would have never thought to do what that thread suggests (dump the classifier into a regressor to get the confidence…).

Kind of tested this now with the fluild.mlpregressor~ dump approach and it’s super binary in terms of it’s output. As in, it flip flops from being 0.99 0.01 to 0.01 0.99 with nothing in between. Even doing different types of hits/sounds, it classifies it as just about 100% each. I did manage to occasionally get it to do 80/20 or at one point I even saw a 60/40 but it didn’t seem to return any meaningful differentiation from moving from the center to the edge.

I don’t know if that’s a function of these specific hits, or the fact there’s only two classes, or if this requires computing means first so then it can get a distance to those, rather than measuring the confidence vector of the actual classes themselves.

It seems like this indicates that the classifier is working really well as it’s quite certain each class is exactly what it says it is, but does nothing really to give me the spectrum between the two.

When I briefly tried I was unable to get what I needed out of the regressor from the same data, and even then I’d need to recode the hotest output finder (but I didn’t try that hard), so yes what I have in my custom version outputs two further values (I forget what they both are) that are designed to give some indication of confidence. I think those values would be derivable from the regressor but it was easier to add them to the output for what I needed.

I don’t use them to create interpolations between categories and I’d expect them to very poor at indicating that (as @rodrigo.constanzo has found above. What I use them for is to allow the classifier to have no output (as in - the match is not confident enough to be responded to).

1 Like

That’s also quite useful too.

This makes me wonder if they (Sensory Percussion, in the link above) are doing something other than interpolating between the classes. They call it “timbre”, though in the software you explicitly have to say which two classes you are going between (“center” and “edge”, or “rim tip” and “rim shoulder” etc…). The fact that you are starting from classes is what leads me to believe that’s the case, but it could just be that class confidence is quite different from the distance to the mean.

It depends how they are detecting the classes, but also they may use some kind of spectral similarity measure, or use timbre as a term that basically equates to position on the drum head.

It’s all closed source, so not sure, but from this thread ages ago I remember finding this:
b0a315b38311ba316bc732a7f32d3e79a3bf2956_2_386x500

So fundamentally MFCCs->classifier, with the “geometric interpretation engine” (and instant “fitting” in their software) leading me to believe that it’s a KNN-type thing.

No clue what that “neural network trained on pre-labelled data” part means, as it’s at the spectral analysis stage.

As in another descriptor type?

The sound difference is fairly subtle:
center and edge example.wav.zip (167.3 KB)

For certain they are using “timbre” as a metaphor here (well I guess it’s always a metaphor in a computer) and instead doing something with the classes/differentiation. Part of the reason why I didn’t implement something like this before was that I was happy with just having “real” timbral descriptors going on (loudness/centroid/flatness/etc…) so wasn’t fussed about this specific idea or implementation, but for rounding things out in the toolbox, it would be handy to have.

I plan on computing the means today to see if I can do something with that (step2 above).

Surely there’s a better way to do this, but I’ve:

  • unpacked fluid.dataset~ / fluid.labelset~ to dicts
  • dict.unpack data: just to get the data bits
  • push_to_coll to move into coll-land
  • use the label coll to fork the MFCC coll into a separate coll per class
  • pull_from_coll back into dict-land and load into fluid.dataset~s (one per class)
  • tobuffer the fluid.dataset~s to get them into buffer~s
  • fluid.bufstats~ to get the means per column (now channels)
  • fluid.buf2list @axis 1 to get the mean of each class

What a journey!

I could probably skip the coll stuff and operate on the dict versions, I just know the coll syntax offhand so did stuff there. But it was quite a tour the fluid.objects~ to do this!

Ok, it’s possible I messed up the math for the class means, but as far I can tell I did it correctly (it’s the right amount of hits/columns/etc… at each step) and the knearestdist doesn’t seem to really correspond to anything.

edit:
It’s important to say that this is an unnormalized/unreduced space, so 104d of raw MFCCs/stats as that is what I found worked best for the classification/matching. It’s possible that distance doesn’t work so well like this.

The classifier seems to work fine here (matching “center” and “edge” respectively) but in this case the distance to the 2nd point is always greater than the first one and it doesn’t seem to correlate to any change in position at all:

This is a 2d UMAP reduction of what I’m working with, so the classes are fairly distinct:
Screenshot 2023-05-09 at 1.48.17 PM

There’s a couple errand points in there, but two pretty well defined clusters.

Is there a way to place/visualize the means in this space? This is a 2d UMAP reduction from 104d. So my means is two entries of 104d each.

I guess I can just fit or transform that point into the UMAP space, but don’t know if that placement would be representative of it would be in the 104d space.

Aaaand following this up with more testing.

I’ve created normalized, robustscaled, and standardized versions of the training datasets (and class means), and then am transformpoint-ing them before feeding them into the KDTree and still no meaningful difference in the distance metric.

I guess since the metric is a sum of all differences, the high dimensional space kind of regresses to the mean or something?

Here you can see the spread (each multislider represents a frame of 104d data (12 MFCCs + min/mean/max/std + 1deriv)

The knearestdist varies a bit, but not in any obvious right or left-leaning way.

I’m wondering if I need to reduce it down to a 2 or 3d space in order for the distance metric to mean something in this context?

edit:

Also double-checked the means for my classes and it looks right.

raw dataset:

0     33.909   -5.1534    7.4311       ...    2.0758     9.974    2.5649
1     49.644   -9.4954   -1.0355       ...    6.8681    9.5761    2.3219
10     43.111   -9.2246    6.9809       ...    6.0569    3.4346    7.2621
       ...
97      42.06  0.071087   0.74264       ...    4.9557    6.7441    3.3876
98     68.636   -6.1345   -5.1666       ...    3.4278    4.2649    3.4061
99     58.526   -2.4483   -7.2108       ...    4.1994    7.9537    7.1264

raw class means:

0     45.792   -5.1614    4.7455       ...    4.5843    5.7024    3.3462
1     56.442   -5.7961   -2.5477       ...    6.7063    5.4215    4.8233

So eyeballing that and it looks like the means are computed correctly (literally the mean of the respective “columns” in the original dataset.

edit edit:

Here’s the plotting of each of the classes too.

raw:

normalize:
normalize

robustscale:
robustscale

standardize:
standardize

I don’t know if I can plot my means on the same space because of how UMAP works, but that would be handy here. (basically I have a separate dataset with 2 points, one for each class. and each point has 104d. can I unpack each point into a buffer and transformpoint with the same UMAP that created this space and expect it to place the new points into the same space, or would they have had to been there at the time of the initial UMAP transform?)

because UMAP distorts the space, it might also rotate it. It is quite well explained here in the section " How to (mis)read UMAP"

UMAP will compute distances in the high dimension first (to care about the neighbours) so my hunch is that if it is successfully clustering (as it seems to be doing) then distance in the HD should mean something (even if the scale might be strange)

have you tried kmeans on them in the end?

1 Like

As in, running it into kmeans and asking for 2 clusters?

I’ve not tried that yet, and I’m a bit suspicious of that as a step as it may end up finding clusters incorrectly (vs the supervised approach). These sounds do seem to cluster quite nicely (barring that a couple random red dots in the green bits in some projections).

That’s good to know.

I suspect the distance is useful, but since it’s (I guess?) the sum of all the individual distances, that regresses towards the mean in a way that makes the aggregate distance metric useful (for this purpose specifically).

yes. or what you can do is run kmeans by adding in manually your computed centroids. See the 2nd tab in max, ‘accessing the means’, to see how it works - although there is a bug in the preset, it should be <0 0.1 0.1, 1 0.9 0.1, 2 0.1 0.9, 3 0.9 0.9, bang> to seed - I’ll correct it in the next release

it isn’t the sum, it is euclidian distance (Pythagora theorem applies to more than 2D) - in other words, the straight line. Hence me repeating over and over how important scales are since 1 = 1 in whatever dimension for that distance, which might not be the case for real (and the dangers of mindless normalisation/standardisation/etc)

Doesn’t that still do the same thing? As in, take the seeded means I’ve given it, then find what it thinks are the nearest matches (unsupervised). For this use case I don’t want it to put anything in clusters that haven’t specifically been trained.

In the initial examples above it’s raw/uncooked MFCCs all around, so everything is in the same domain/range. Testing all the different scaling approaches didn’t improve things, though in any case when one was scaled, the corresponding data was also scaled, so 1 = 1 in every example above.

It was more a comment that in these examples (from above), even though it is correctly identifying the class (see the UI on the right with “center” and “edge” lit up for each example), that the knearestdist doesn’t seem to output numbers in a range (or distribution) that points to it being more one or the other.

So here it correctly identifies the “center” and gives me knearestdist 28.461424 58.615948:
f38b5eaa74cc714c423ce5f5b0b36a8528240248_2_642x500

And in this one it correctly identifies “edge” and gives me knearestdist 44.158624 58.077026
c3b3e06a4045351c0734f0c2a6970c4a7db07038_2_690x489

With those two values being the Euclidean distance between the means of each class.

yes but as I suggested above, you can probably use it to tweak, with a single iteration. but you can also find quick distance matrix with it if you need that.

if only that was true. MFCCs are funny because they are less and less wide in range - but simple normalisation overweight the top dimensions. I cannot remember the IRCAM research paper I read on a perceptually valid normalisation of them but it is neither independent nor based on a single one…

it does. 58 is far for the 2nd class but that number is irrelevant, it is the first one that matters, and more importantly, the fact that it is right so that the smaller distance is truer than the largest distance. If all your edges (2nd example) distance are in the 40s it just means your training set’s centroid is far from your input.

I remember @weefuzzy one time mentioning this as a potential perk (at least I remember this way), as it would overemphasize the higher coefficients in a way that exaggerated the differences.

I also remember a bunch of chatter a few years ago with @tutschku testing “the IRCAM MFCCs” vs “the FluCoMa MFCCs” and the IRCAM ones winning out (at least back then, this was definitely before loudness weighting was added etc…).

Looking a the data again and, as far as I can tell, there’s very little correlation between the output of knearestdist and the input (visually). As in, the 2nd distance is always bigger, and the 1st one one jumps around between hit from like 30something to 40/50something. I guess while the “edge” examples are playing the two sliders are slighty closer to each other, but not in a meaningful way.

In this case I’m feeding it the same audio I trained it on…