Based on many recent discussions around AudioGuide and how things are implemented there I got to experimenting with linear regression on every frame of a loudness analysis. I go into a lot more detail in this post in timeness thread, but I wanted to make a separate thread to act as a feature request.
To summarize, I did some testing and comparing between the slope of the linear regression function (from this javascript implementation) and in terms of “accurately” representing the morphology inherent in a time-series, it appears to perform much better than the mean of the derivative (of loudness).
There are more examples in the other thread, but here are a couple just to show what I mean.
Pretty similar results here:
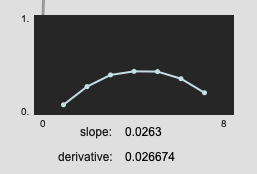
Here we see a bit more of the difference:
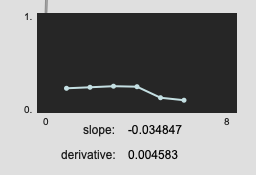
(edit: the results aren’t always this dramatic, turns out I had messed up some of the maths for the derivative, but they generally are better, and you get the benefit of a corresponding r2 value)
Although I didn’t implement in my Max version (yet), there is the r2 output, which can also act as a kind of “slope confidence”, which we also don’t get from the derivatives.
So it would be great to see linear regression as one of the statistics available in fluid.bufstats~.
(I’ve implemented it in Max already but it’s a bit faffy to code, not to mention the workflow problems of dumping the contents of a buffer~ out into list-land, only to shove it all back into a buffer~ and then onto a fluid.dataset~. And then having to do this per descriptor that you want the values for…)
 Try again.